Tag

employment/labor

Browsing


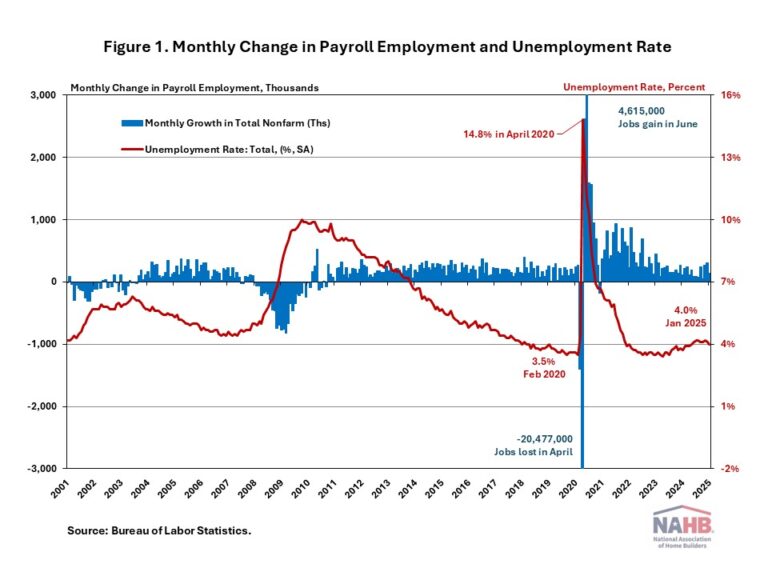
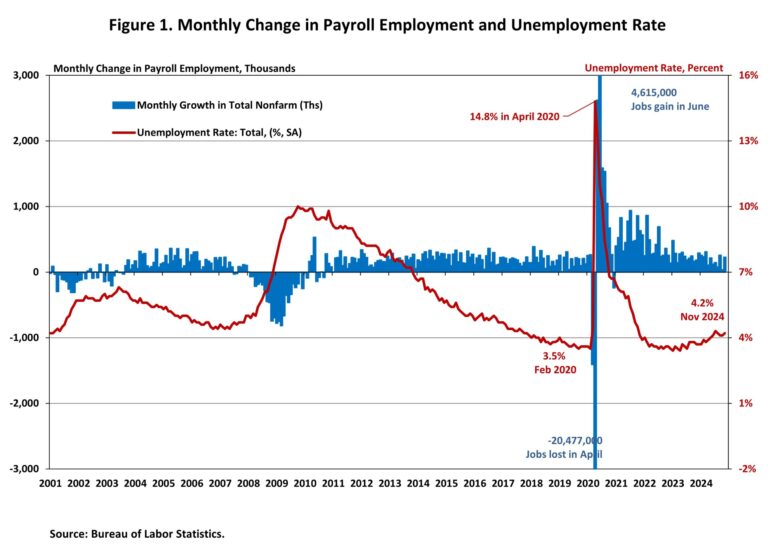
U.S. job growth slowed in January amid Southern California wildfires and severe winter weather across much of the country. Meanwhile, the unemployment rate edged down to 4.0%. This month’s data indicates that the labor market is slowing at the start of 2025 but remains healthy.

In January, wage growth remained unchanged from the previous month. Year-over-year, wages grew at a 4.1% rate, down 0.2 percentage points from a year ago. Wage growth is outpacing inflation, which typically occurs as productivity increases.

On the annual benchmark revision of the Current Employment Statistics (CES), the seasonally adjusted total nonfarm employment for March 2024 was revised down by 589,000. The average monthly pace of job growth for 2024 was revised down from a previous estimate of 186,000 per month to an average of 166,000.

National Employment

According to the Employment Situation Summary reported by the Bureau of Labor Statistics (BLS), total nonfarm payroll employment rose by 143,000 in January, the lowest monthly gain in the past three months. Since January 2021, the U.S. job market has added jobs for 49 consecutive months, making it the third-longest period of employment expansion on record.

The estimates for the previous two months were revised up. The monthly change in total nonfarm payroll employment for November was revised up by 49,000, from +212,000 to +261,000, while the change for December was revised up by 51,000 from +256,000 to +307,000. Combined, the revisions were 100,000 higher than previously reported.

The unemployment rate decreased to 4.0% in January, after accounting for the annual adjustments to the population controls. While the number of employed persons increased by 2,234,000, the number of unemployed persons decreased by 37,000.

Meanwhile, the labor force participation rate—the proportion of the population either looking for a job or already holding a job—increased one percentage point to 62.6%. For people aged between 25 and 54, the participation rate rose one percentage point to 83.5%. While the overall labor force participation rate remains below its pre-pandemic levels of 63.3% at the beginning of 2020, the rate for people aged between 25 and 54 exceeds the pre-pandemic level of 83.1%.

In January, employment in health care (+44,000), retail trade (+34,000), and social assistance (+22,000) increased, while employment declined in the mining, quarrying, and oil and gas extraction industries.

Construction Employment

Employment in the overall construction sector increased by 4,000 in January, after 13,000 gains in December. While residential construction lost 200 jobs, non-residential construction employment added 4,400 jobs for the month.

Residential construction employment now stands at 3.4 million in January, broken down as 956,000 builders and 2.4 million residential specialty trade contractors. The 6-month moving average of job gains for residential construction was 1,350 a month. Over the last 12 months, home builders and remodelers added 40,100 jobs on a net basis. Since the low point following the Great Recession, residential construction has gained 1,376,600 positions.

The unemployment rate for construction workers has remained at a relatively lower level, after reaching 15.3% in April 2020 due to the housing demand impact of the COVID-19 pandemic.

Discover more from Eye On Housing

Subscribe to get the latest posts sent to your email.


This article was originally published by a eyeonhousing.org . Read the Original article here. .

After a period of slowing associated with declines for some elements of the residential construction industry, the count of open construction sector jobs remained lower than a year ago, per the December Bureau of Labor Statistics Job Openings and Labor Turnover Survey (JOLTS).

The number of open jobs for the overall economy decreased from 8.16 million in November to 7.6 million in December. This is notably smaller than the 8.89 million estimate reported a year ago and reflects a softened aggregate labor market. Previous NAHB analysis indicated that this number had to fall below 8 million on a sustained basis for the Federal Reserve to feel more comfortable about labor market conditions and their potential impacts on inflation. With estimates remaining below 8 million for national job openings, the Fed in theory should be able to cut further despite a recent pause.

The number of open construction sector jobs decreased from a revised 272,000 in November to just 217,000 in December. This marks a significant reduction of open, unfilled construction jobs than that registered a year ago (434,000) due to a slowing of construction activity because of elevated interest rates.

The construction job openings rate moved lower to 2.5% in December, significantly down year-over-year from 5.1%. This is the lowest open rate for the construction sector since 2017.

The layoff rate in construction stayed low (1.8%) in December. The quits rate moved lower to 1.4% in December. This is the lowest quits rate for construction since the third quarter of 2020.

Discover more from Eye On Housing

Subscribe to get the latest posts sent to your email.


This article was originally published by a eyeonhousing.org . Read the Original article here. .


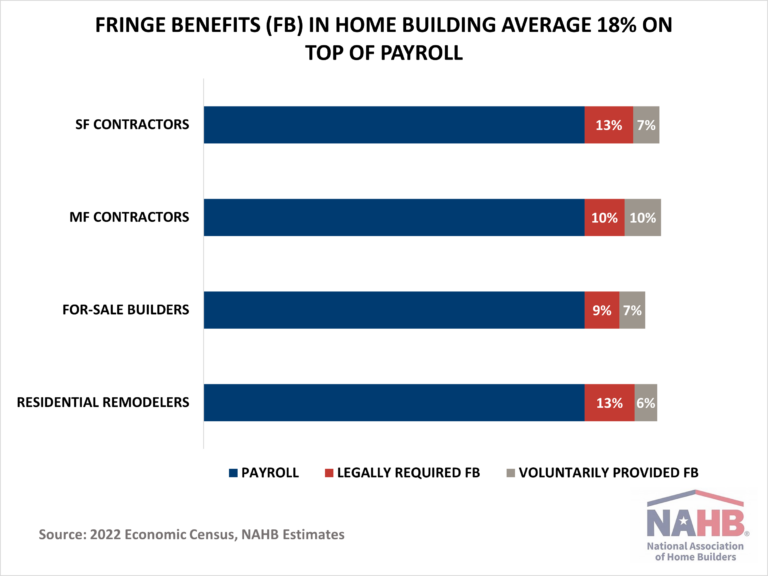
In the home building industry, fringe benefits add an additional 18% to employees’ compensation on top of payroll, according to NAHB’s analysis of the latest 2022 Economic Census data. The rates vary across residential construction sub-sectors with single-family and multifamily general contractors contributing an average of 20% on top of payroll. Fringe benefits in residential remodeling and for-sale building average 19% and 16%, respectively.

Total fringe benefits consist of legally required and voluntarily provided benefits. The legally required component includes employers’ contribution to Social Security and Medicare, unemployment insurance, worker’s compensation insurance, and state-mandated temporary disability and other state-specific contributions. Since these benefits are mandatory by law, it may seem counter-intuitive to view them as “fringe” benefits. Nevertheless, the Economic Census counts them as “legally required fringe benefits” paid on top of payroll.

In 2022, legally required fringe benefits contributed by single-family general contractors and remodelers amounted to an additional 13% on top of payroll. The average rate for multifamily general contractors and for-sale builders was 10% and 9%, respectively. Averaged across the four subsectors of home building, legally required benefits amounted to just under 12% of payroll.

Voluntarily provided fringe benefits include expenditures paid by employers for life insurance premiums, pension plans, insurance premiums on hospital and medical plans, welfare plans, and union negotiated benefits. Other perks provided by employers, such as paid holidays, vacations, sick pay, bonuses, and jury pay, may seem like valuable “fringe” benefits but are technically counted in payroll.

In 2022, voluntary fringe benefits provided by multifamily general contractors amounted to an additional 10% on top of payroll.  In the case of single-family contractors and for-sale builders, these benefits added 7% to compensation. The rate was lower for residential remodelers, where voluntary benefits amounted to 6% of payroll. Averaged across the four sub-sectors of home building, the voluntarily provided benefits approached an added cost of 7% on top of payroll.

In addition to the four residential construction subsectors discussed above, the home building industry also includes land developers and specialty trade contractors (STC). Since the Economic Census does not differentiate between residential and non-residential specialty trade contractors, this combined subsector is not included in the home building chart above. Nevertheless, the latest Economic Census shows that the fringe benefit rates were highest among specialty trade contractors – 28%, equally split between legally required and voluntary.

Among other things, the differences in the fringe benefit rates reflect variations in state-mandated regulations, size and legal form of companies, involvement in federally funded projects, unionization of workers, and employee participation rates in health and pension plans. For example, depending on the legal form of organization, accounting principles are different and can affect the estimated fringe benefit rates. For corporations, payroll includes compensation of executives, but for unincorporated businesses, such as individual proprietorships and partnerships, payroll excludes profit and other compensation of proprietors or partners. In addition, partners and proprietors may not be ineligible for the complete benefits package they offer to employees, also affecting the estimated fringe benefit rates for their businesses.

The data used in this analysis come from the Economic Census available only every five years. The Economic Census, like many other federal statistics programs, collects data only on establishments with payroll employees. In construction, an establishment operates continually at a single physical location but typically manages more than one project or job. A large building company may operate at more than one location but would file a separate report for each location or establishment.

Discover more from Eye On Housing

Subscribe to get the latest posts sent to your email.


This article was originally published by a eyeonhousing.org . Read the Original article here. .

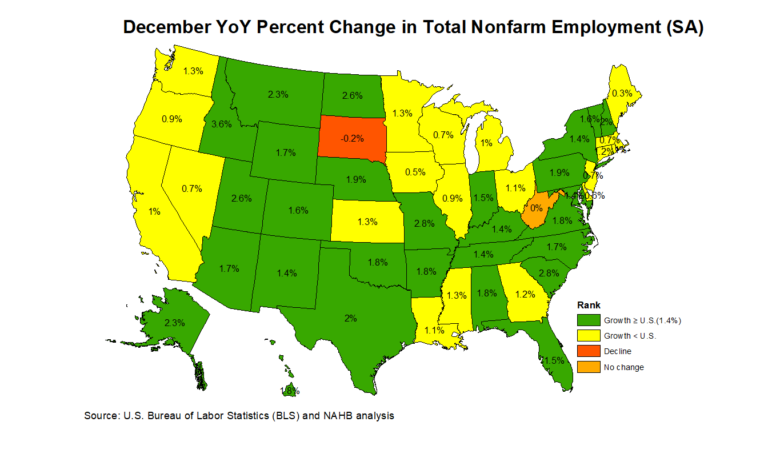
Nonfarm payroll employment increased in 42 states and the District of Columbia in December compared to the previous month, while it decreased in seven states. Wyoming reported no change during this time. According to the Bureau of Labor Statistics, nationwide total nonfarm payroll employment increased by 256,000 in December, following a gain of 212,000 jobs in November.

On a month-over-month basis, employment data was most favorable in Texas, which added 37,500 jobs. Florida came in second (+18,000), followed by California (+15,000). A total of 8,000 jobs were lost across seven states, with Oregon reporting the steepest job losses at 3,700. In percentage terms, employment increased the highest in Missouri at 0.4%, while Vermont saw the biggest decline at 0.2% between November and December.

Year-over-year ending in December, 2.2 million jobs have been added to the labor market across 48 states and the District of Columbia. This is a 1.4% increase compared to the December 2023 level. West Virginia reported no change, while South Dakota lost 1,000 jobs. The range of job gains spanned from 2,000 jobs in Maine to 284,200 jobs in Texas. In percentage terms, the range of job growth spanned 3.6% in Idaho to 0.3% in Maine. South Dakota declined by 0.2%.

Across the nation, construction sector jobs data —which includes both residential and non-residential construction—showed that 26 states reported an increase in December compared to November, while 20 states lost construction sector jobs. The four remaining states and the District of Columbia reported no change on a month-over-month basis. Washington, with the highest increase, added 4,000 construction jobs, while New York, on the other end of the spectrum, lost 4,400 jobs. Overall, the construction industry added a net 8,000 jobs in December compared to the previous month. In percentage terms, South Dakota reported the highest increase at 1.9% and Mississippi reported the largest decline at 2.2%.

Year-over-year, construction sector jobs in the U.S. increased by 196,000, which is a 2.4% increase compared to the December 2023 level. Texas added 31,500 jobs, which was the largest gain of any state, while California lost 12,400 construction sector jobs. In percentage terms, Alaska had the highest annual growth rate in the construction sector at 18.9%. Over this period, West Virginia reported the largest decline of 3.4%.

Discover more from Eye On Housing

Subscribe to get the latest posts sent to your email.


This article was originally published by a eyeonhousing.org . Read the Original article here. .

A key indicator of the labor market is the labor force participation rate. This rate is the percentage of working-age adults in a population who are working or looking for work. The rate is a critical measure connected to both housing demand and housing supply (via the construction labor force).

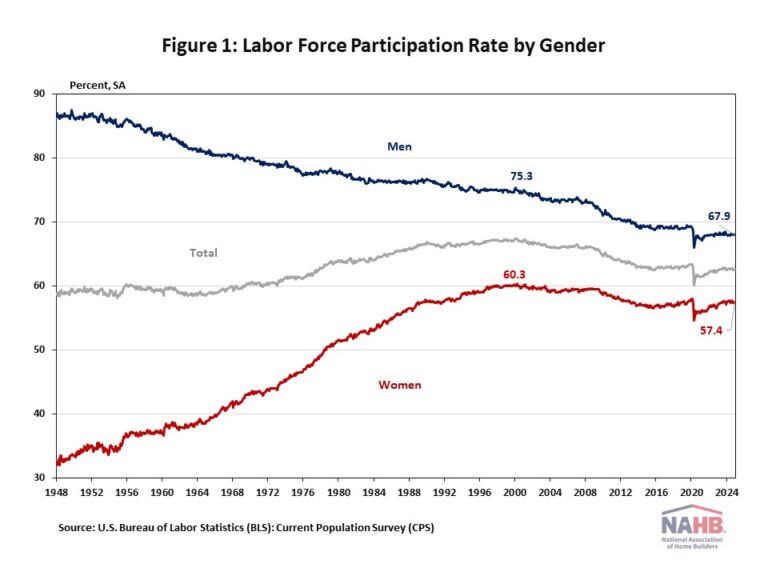
According to the Employment Situation Summary reported by the Bureau of Labor Statistics (BLS), the labor force participation rate remained at 62.5% for the third month in December 2024. After the labor force participation rate reached 67.3% at the beginning of 2000, it has been trending lower. When COVID-19 hit the labor market, the labor force participation rate dropped dramatically from 63.3% in February 2020 to 60.1% in April 2020. The latest labor force participation rate remains below its pre-pandemic levels of 63.3% at the beginning of 2020.

The participation rate is directly connected to the supply of labor. Labor supply varies across different demographic groups, such as age, gender, race, and educational attainment.

Gender

Over time, labor force participation changed dramatically by gender due to evolving societal norms around gender roles. Historically, women experienced a significant increase in labor force participation while men’s participation rates declined. However, over the past 20 years both genders’ labor force participation rates have moved in parallel and been trending downwards. Women’s labor force participation rate is 2.9 percentage points below the peak level in 2000 of 60.3%, while men’s labor force participation rate is 7.4 percentage points lower than the level in 2000 of 75.3%.

According to the latest data from the Current Population Survey (CPS), women currently make up roughly half of the U.S. labor force, representing about 47% of the labor force market. By industry, women accounted for more than half of all workers within several sectors in 2023, such as education and health services (74.4%), other services (53.3%), financial activities (51.1%), and leisure and hospitality (50.8%). Comparably, women were substantially underrepresented (relative to their share of total employment) in manufacturing (29.5%), agriculture (29.3%), transportation and utilities (24.3%), mining (15.3%), and construction (10.8%).

Men tend to have a higher labor force participation rate than women historically, even though this gap has narrowed from 54.7 percentage points in January 1948 to a difference of 10.5 percentage points in December 2024.

Age

The labor force participation rate differs across age groups as well. People ages 65 and older had the lowest labor force participation rate of 19.2%, followed by the youngest age group (16-19 years old) with a participation rate of 36.9%.

Among all age groups, workers aged 25-54, also known as prime-age workers, have the highest labor force participation rate of 83% in 2023. They form the core of the U.S. labor force, accounting for nearly two-thirds (63.8%) of the total labor force. Prime-age workers’ labor force participation rate has fully recovered from the COVID-19 pandemic, surpassing the prior peak of February 2020. The high labor force participation among prime-age men and the rapid increase in prime-age women’s labor force participation contributed to the increase in the labor force over time. By December 2024, prime-age women’s participation rate had hovered near its highest level of 78.1% on record, and 89.0% of prime-age men stayed in the labor force market.

Race and Ethnicity

Labor force participation varies among the largest race and ethnic groups living in the United States, and each group’s labor participation differs according to their gender as well.

Men had a higher labor force participation rate than women in each racial and ethnic group. Among men ages 16 years and over, Hispanic men were the most likely to be in the labor force, with a participation rate of 75.1%, followed by Asian men (76.8%), White men (68.2%), and Black men (65.6%). Among women ages 16 and over, Black women (61.0%) were most likely to participate in the labor force, followed by Hispanic women (58.7%), Asian women (58.1%), and White women (56.5%).

Educational Attainment

Higher levels of educational attainment are generally associated with higher labor force participation rates and lower unemployment rates. It is true for both men and women, and the four selected racial and ethnic groups that people with higher educational attainment tend to have greater employment opportunities and potentially later retirement ages.

With the same level of educational attainment, men are more likely to work than women. Among men with less than a high school diploma, the labor force participation rate was 59.4%, compared to a 34.3% participation rate for women with the same level of educational attainment. The gap of the labor force participation rate between men and women narrows as people achieve higher educational attainment. Women with the highest broad level of education (a bachelor’s degree or higher) have a 69.6% participation rate, a 7.3 percentage point difference from men with the same level of education (76.9%).

Discover more from Eye On Housing

Subscribe to get the latest posts sent to your email.


This article was originally published by a eyeonhousing.org . Read the Original article here. .

The U.S. labor market finished 2024 with solid job growth and a decrease in the unemployment rate.

In December, wage growth slowed. Wages grew at a 3.9% year-over-year (YOY) growth rate, down 0.3 percentage points from a year ago. Wage growth is outpacing inflation, which typically occurs as productivity increases.

National Employment

According to the Employment Situation Summary reported by the Bureau of Labor Statistics (BLS), total nonfarm payroll employment rose by 256,000 in December. Since January 2021, the U.S. job market has added jobs for 48 consecutive months, making it the third-longest period of employment expansion on record.

The estimates for the previous two months were revised. The monthly change in total nonfarm payroll employment for October was revised up by 7,000, from +36,000 to +43,000, while the change for November was revised down by 15,000 from +227,000 to +212,000. Combined, the revisions were 8,000 lower than previously reported.

In 2024, more than 2.3 million jobs were created. Additionally, monthly employment growth averaged 186,000 per month, compared to the 251,000 monthly average gain for 2023. The U.S. economy has created nearly 8.7 million jobs since March 2022, when the Fed enacted the first interest rate hike of this cycle.

The unemployment rate decreased to 4.1% in December. While the number of employed persons increased by 478,000, the number of unemployed persons decreased by 235,000.

Meanwhile, the labor force participation rate—the proportion of the population either looking for a job or already holding a job—remained unchanged at 62.5%. For people aged between 25 and 54, the participation rate decreased one percentage point to 83.4%. While the overall labor force participation rate remains below its pre-pandemic levels of 63.3% at the beginning of 2020, the rate for people aged between 25 and 54 exceeds the pre-pandemic level of 83.1%.

In December, employment continued to trend up in health care (+46,000), government (+33,000), and social assistance (+23,000). Retail trade added 43,000 jobs, following a job loss in November.

Construction Employment

Employment in the overall construction sector increased by 8,000 in December, after 8,000 gains in November. While residential construction gained 4,000 jobs, non-residential construction employment added 4,700 jobs for the month.

Residential construction employment now stands at 3.4 million in December, broken down as 961,000 builders and 2.4 million residential specialty trade contractors. The 6-month moving average of job gains for residential construction was 3,333 a month. Over the last 12 months, home builders and remodelers added 51,000 jobs on a net basis. Since the low point following the Great Recession, residential construction has gained 1,396,200 positions.

In December, the unemployment rate for construction workers rose to 5.5% on a seasonally adjusted basis. The unemployment rate for construction workers has remained at a relatively lower level, after reaching 15.3% in April 2020 due to the housing demand impact of the COVID-19 pandemic.

Discover more from Eye On Housing

Subscribe to get the latest posts sent to your email.


This article was originally published by a eyeonhousing.org . Read the Original article here. .
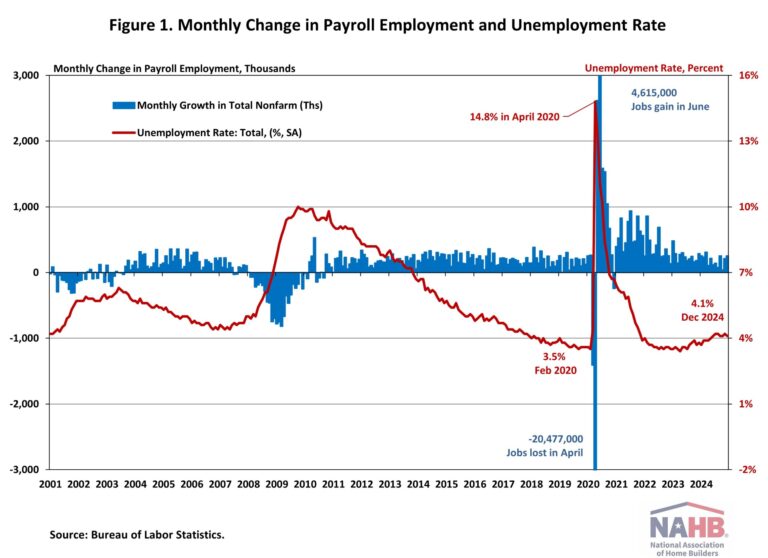

After a period of slowing associated with declines for some elements of the residential construction industry, the count of open construction sector jobs has remained lower than a year ago, per the November Bureau of Labor Statistics’ Job Openings and Labor Turnover Survey (JOLTS). However, the most recent data showed a slight gain for the number of open construction sector jobs.

The number of open jobs for the overall economy increased from 7.84 million to 8.10 million in November. Nonetheless, this is notably smaller than the 8.93 million estimate reported a year ago and reflects a softened aggregate labor market. Previous NAHB analysis indicated that this number had to fall below 8 million on a sustained basis for the Federal Reserve to feel more comfortable about labor market conditions and their potential impacts on inflation. With estimates remaining below 8 million for national job openings, the Fed is continuing a policy of interest rate cuts.

The number of open construction sector jobs increased from a revised 259,000 in October to 276,000 in November. Nonetheless, the November reading of opening, unfilled construction jobs is lower than that registered a year ago (454,000) due to a slowing of construction activity because of elevated interest rates.

The construction job openings rate edged higher to 3.2% in November but remains lower than a year ago, albeit with a fair amount of statistical month-to-month noise in the recent data.

The layoff rate in construction remained in the 2% range in November (2.1%). The quits rate in construction fell to 1.7% in November.

Discover more from Eye On Housing

Subscribe to get the latest posts sent to your email.


This article was originally published by a eyeonhousing.org . Read the Original article here. .

Nonfarm payroll employment increased in 38 states and the District of Columbia in November compared to the previous month, while it decreased in 12 states. According to the Bureau of Labor Statistics, nationwide total nonfarm payroll employment increased by 227,000 in November, following a meager gain of 32,000 jobs in October.

On a month-over-month basis, employment data was most favorable in Florida, which added 61,500 jobs, rebounding from the hurricanes that hit the sunshine state in October. Washington came in second (+30,900), followed by North Carolina (+15,000). A total of 20,300 jobs were lost across 12 states, with Colorado reporting the steepest job losses at 3,900. In percentage terms, employment increased the highest in Washington at 0.9%, while Vermont saw the biggest decline at 0.3% between October and November.

Year-over-year ending in November, 2.3 million jobs have been added to the labor market across 49 states and the District of Columbia. This is a 1.4% increase compared to November 2023 level. South Dakota reported no change. The range of job gains spanned from 2,900 jobs in West Virginia to 274,300 jobs in Texas. In percentage terms, the range of job growth spanned 3.1% in Idaho to 0.3% in Iowa.

Across the nation, construction sector jobs data —which includes both residential and non-residential construction—showed that 23 states and the District of Columbia reported an increase in November compared to October, while 23 states lost construction sector jobs. The four remaining states reported no change on a month-over-month basis. Florida, with the highest increase, added 7,600 construction jobs, while Indiana, on the other end of the spectrum, lost 3,400 jobs. Overall, the construction industry added a net 10,000 jobs in November compared to the previous month. In percentage terms, Minnesota reported the highest increase at 2.1% and Indiana reported the largest decline at 2.0%.

Year-over-year, construction sector jobs in the U.S. increased by 211,000, which is a 2.6% increase compared to the November 2023 level. Texas added 32,200 jobs, which was the largest gain of any state, while California lost 11,500 construction sector jobs. In percentage terms, Alaska had the highest annual growth rate in the construction sector at 20.3%. Over this period, Maryland reported the largest decline of 2.3%.

Discover more from Eye On Housing

Subscribe to get the latest posts sent to your email.


This article was originally published by a eyeonhousing.org . Read the Original article here. .


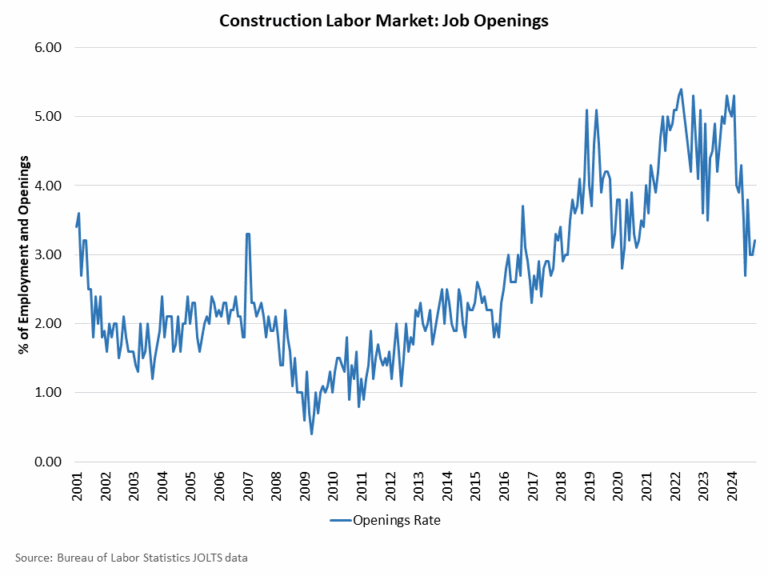
As reported in a previous post, immigrants make up one in four workers in the construction industry. The share of immigrants is significantly higher (32.5%) among construction tradesmen. In some states, reliance on foreign-born labor is particularly evident, with immigrants comprising over 40% of the construction workforce in California and New Jersey, and 38% – in Texas and Florida.

According to the government’s system for classifying occupations, the construction industry employs workers in about 390 occupations. Out of these, only 28 are construction trades, yet they account for almost two thirds of the construction labor force. The other one-third of workers are in finance, sales, administration and other off-site activities.

The concentration of immigrants is particularly high in construction trades essential for home building, such as plasterers and stucco masons, drywall/ceiling tile installers (61%), roofers (52%), painters (51%), carpet/floor/tile installers (45%).

The two most prevalent construction occupations, laborers and carpenters, account for over a quarter of the construction labor force. A third of all carpenters and 42% of construction laborers are of foreign-born origin. These trades require less formal education but consistently register some of the highest labor shortages in the NAHB/Wells Fargo Housing Market Index (HMI) and NAHB Remodeling Market Index (RMI) surveys.

In the latest February 2024 HMI Survey, 65% of builders reported some or serious shortage of workers performing finished carpentry. Looking at other tradesmen directly employed by builders, the shortages of bricklayers and masons are similarly acute, despite a high presence of immigrant workers in these trades.

Labor shortages are also high among electricians, plumbers and HVAC technicians, with over half of surveyed builders reporting shortages of these craftsmen. In contrast, these trades demand longer formal training, often require professional licenses and attract fewer immigrants.

More than half (53%) of the three million immigrant construction workers reside in the four most populous states in the U.S. – California, Texas, Florida, and New York.  California and Texas have over half a million foreign-born construction workers each. Combined, these two states account for over a third (35%) of all immigrant construction workers. Florida and New York combined account for an additional 18%.

These are not only the most populous states in the U.S., but as traditional gateway states, they are also particularly reliant on foreign-born construction labor. Immigrants comprise 41% of the construction workforce in California. In Florida and Texas, 38% of the construction labor force is foreign-born. In New York, 37% of construction industry workers come from abroad. 

The reliance on foreign-born labor continues to spread outside of these traditional immigrant magnets. This is evident in states like New Jersey, that registered the second highest share of immigrant workers, 40%, in 2023, closely following California. Nevada and Maryland, where immigrants (as of 2023) account for over a third of the construction labor force (36%) also illustrate spreading reliance on immigrant labor.

In Georgia, Connecticut, North Carolina, Virginia, Arizona, Massachusetts, and Illinois, more than a quarter of construction workers are foreign-born. At the other end of the spectrum, seven states – Montana, North and South Dakota, Vermont, Maine, West Virginia, and Alaska – have share of immigrant workers of less than 5%.

Because immigrant workers are disproportionately concentrated within the construction trades, immigrant presence among craftsmen is higher than their overall representation in the industry across all states. In California and DC, immigrant workers account for more than half of all tradesmen in construction. In New Jersey and Texas, these shares are similarly high at 49%. In Maryland, Nevada, Florida, New York and Georgia, between 40% and 47% of craftsmen are foreign-born. 

While most states draw the majority of immigrant foreign-born workers from the Americas, Hawaii relies more heavily on Asian immigrants. European immigrants are a significant source of construction labor in New York, New Jersey and Illinois.

Discover more from Eye On Housing

Subscribe to get the latest posts sent to your email.


This article was originally published by a eyeonhousing.org . Read the Original article here. .
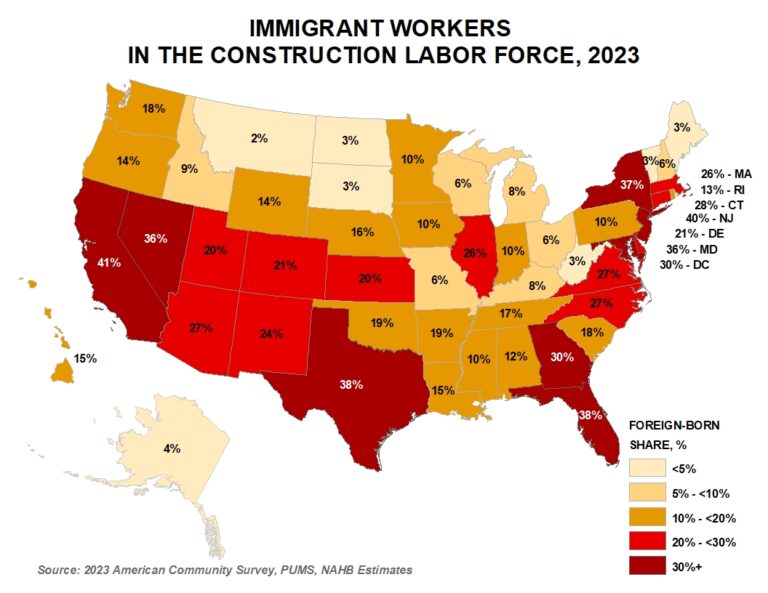

Employment rebounded sharply in November after strike- and hurricane-related disruptions in October. The unemployment rate rose one percentage point to 4.2% after holding at 4.1% for two months in a row.

In November, wage growth remained unchanged from the previous month. Wages grew at a 4.0% year-over-year (YOY) growth rate, down 0.2 percentage points from a year ago. Wage growth is outpacing inflation, which typically occurs as productivity increases.

National Employment

According to the Employment Situation Summary reported by the Bureau of Labor Statistics (BLS), total nonfarm payroll employment rose by 227,000 in November, a sharp rebound from an upwardly revised increase of 36,000 jobs in October. Since January 2021, the U.S. job market has added jobs for 47 consecutive months, making it the third-longest period of employment expansion on record.

The estimates for the previous two months were revised higher. The monthly change in total nonfarm payroll employment for September was revised up by 32,000, from +223,000 to +255,000, while the change for October was revised up by 24,000 from +12,000 to +36,000. Combined, the revisions were 56,000 higher than previously reported.

In the first eleven months of 2024, 1,984,000 jobs were created. Additionally, monthly employment growth averaged 180,000 per month, compared to the 251,000 monthly average gain for 2023. The U.S. economy has created more than 8 million jobs since March 2022, when the Fed enacted the first interest rate hike of this cycle.

The unemployment rate ticked up to 4.2% in November, marking the seventh month that the unemployment rate has been at or above 4.0%. While the number of employed persons decreased by 355,000, the number of unemployed persons rose by 161,000.

Meanwhile, the labor force participation rate—the proportion of the population either looking for a job or already holding a job—decreased by one percentage point to 62.5%. However, for people aged between 25 and 54, the participation rate remained at 83.5% for the second straight month. While the overall labor force participation rate remains below its pre-pandemic levels of 63.3% at the beginning of 2020, the rate for people aged between 25 and 54 exceeds the pre-pandemic level of 83.1%.

In November, employment continued to trend up in health care (+54,000), leisure and hospitality (+53,000), government (+33,000), and social assistance (+19,000). Employment in transportation equipment manufacturing increased in November as workers who were on strike returned to work. Meanwhile, retail trade lost 28,000 jobs.

Construction Employment

Employment in the overall construction sector increased by 10,000 in November, after 2,000 gains in October. While residential construction gained 3,100 jobs, non-residential construction employment added 6,800 jobs for the month.

Residential construction employment now stands at 3.4 million in November, broken down as 958,000 builders and 2.4 million residential specialty trade contractors. The 6-month moving average of job gains for residential construction was 2,983 a month. Over the last 12 months, home builders and remodelers added 52,400 jobs on a net basis. Since the low point following the Great Recession, residential construction has gained 1,391,400 positions.

In November, the unemployment rate for construction workers remained at 5.3% on a seasonally adjusted basis. The unemployment rate for construction workers has remained at a relatively lower level, after reaching 15.3% in April 2020 due to the housing demand impact of the COVID-19 pandemic.

Discover more from Eye On Housing

Subscribe to get the latest posts sent to your email.


This article was originally published by a eyeonhousing.org . Read the Original article here. .
Pin It