Tag

Employment

Browsing


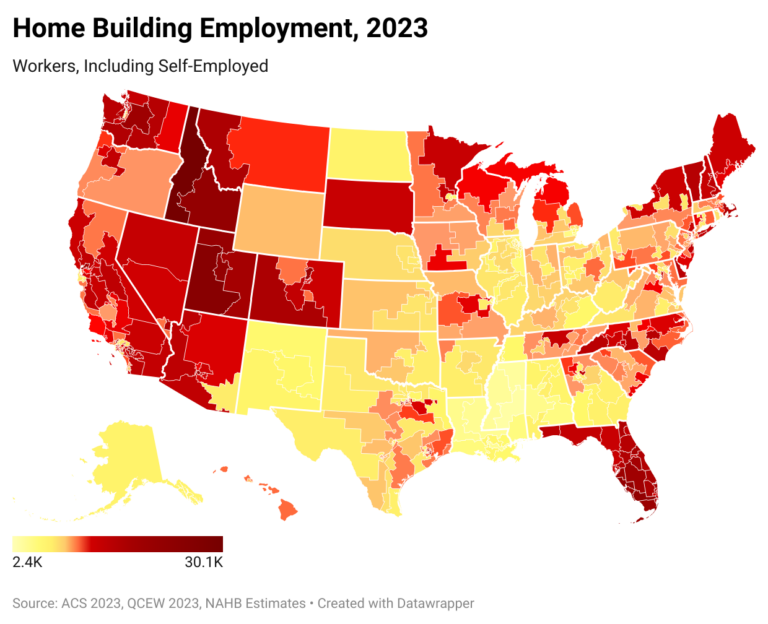
As the number of housing units under construction peaked in 2023, the industry set another record employing close to 11.4 million people, including self-employed workers. NAHB estimates that out of this total, 4.7 million people worked in residential construction, accounting for 2.9% of the U.S. employed civilian labor force. Home building in the Mountain Division, as well as in Vermont and Florida, stand out as generating a significantly higher share of local jobs, with residential construction generating more than 5% of all jobs in Idaho and Montana. NAHB’s analysis also identifies congressional districts where home building accounts for particularly high employment levels and share of local jobs.

Not surprisingly, the most populous state—California—also has the most residential construction workers. Over 640,000 California residents worked in home building in 2023, accounting for 3.4% of the state employed labor force.

Fast-growing Florida comes in second with 468,000 residential construction workers. The state stands out for registering one of the fastest growing populations since the start of the pandemic, which undoubtedly boosted housing and construction workforce demand. Florida’s large stock of vacation and seasonal housing further boosts demand for residential construction workers. As a result, in Florida, residential construction workers account for a relatively high 4.4% of the employed labor. Even though this share is well above the national average (2.9%), it is significantly lower than in 2006, when Florida registered the highest share among all 50 states and the District of Columbia, at 6.5%.

Similar to Florida, fast-growing states with a high prevalence of seasonal, vacation homes top the list of states with the highest share of residential construction workers in 2023. Three states in the Mountain Division – Idaho, Montana, and Utah – take the top spots on the list with 5.5%, 5.1% and 4.9% of the employed labor force working in home building. Vermont is next on the list with a share of 4.6%.  

As of 2023, the average congressional district has about 10,800 residents working in residential construction, but that number is often significantly higher. In Idaho’s 1st Congressional District, over 30,000 residents are in home building and Utah’s 2nd Congressional District has over 25,000 residents working in home building. 

Eight other congressional districts have over 20,000 residents working in residential construction – Florida’s 26th, Utah’s 4th, Idaho’s 2nd, Florida’s 17th, Arizona’s 3rd, Utah’s 1st, Florida’s 28th, and California’s 29th. 

By design, Congressional districts are drawn to represent roughly the same number of people. So generally, large numbers of residential construction (RC) workers translate into high shares of RC workers in their district employed labor forces.  Idaho’s 1st tops this list as well, registering the highest share of residential construction workers in the employed labor force, 6.4%. Florida’s 17th is a close second with 6.3% of the district labor force employed in home building. Next on the list are two Mountain division districts – Montana’s 1st and Utah’s 2nd – with shares of 5.8%, followed by two Florida’s districts – 19th (5.7%) and 26th (5.6%). California’s 29th (5.4%) and 39th (5.3%) also register shares far exceeding the national average of 2.9%.   

At the other end of the spectrum there are several districts that contain parts of large urban areas: the District of Columbia, the 12th of New York, located in New York City, Pennsylvania’s 3rd that includes areas of the city of Philadelphia, Georgia’s 5th that includes most of Atlanta, and among others, Illinois’s 7th and 9th, covering parts of Chicago. Most residents in these urban districts tend to work in professional, scientific, and technical services. The District of Columbia stands out for having the lowest number of RC workers, with just 1,400 residing in the district. At the same time, it has a disproportionally large share of public administration workers. The 12th District of New York and the 7th District of Illinois are home to a very large group of finance and insurance workers. Meanwhile, in Pennsylvania’s 2nd, more than a third of residents work in health care and educational services. 

The NAHB residential construction employment estimates include self-employed workers. Counting self-employed is particularly important in the home building industry since they traditionally make up a larger share of the labor force than in the U.S. total workforce.  

The new NAHB home building employment estimates only include workers directly employed by the industry and do not count jobs created in related industries– such as design and architecture, furniture making, building materials, landscaping, etc.  As a result, the estimates underestimate the overall impact of home building on local employment. 

Discover more from Eye On Housing

Subscribe to get the latest posts sent to your email.


This article was originally published by a eyeonhousing.org . Read the Original article here. .
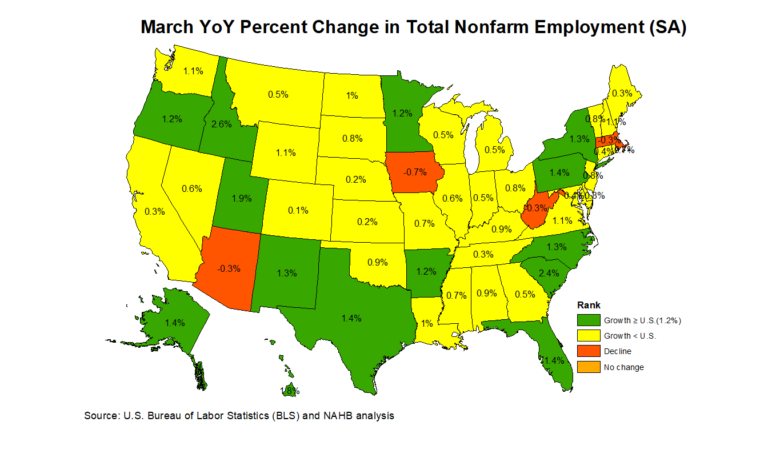

Nonfarm payroll employment increased in 31 states in January compared to the previous month, while it decreased in 19 states and the District of Columbia. California reported no change during this time. According to the Bureau of Labor Statistics, nationwide total nonfarm payroll employment increased by 125,000 in January following a gain of 323,000 jobs in December.

On a month-over-month basis, employment data was most favorable in Texas, which added 27,900 jobs. New York came in second (+20,100), followed by Florida (+16,500). Meanwhile, a total of 101,100 jobs were lost across 19 states and the District of Columbia, with Georgia reporting the steepest job losses at 28,200. In percentage terms, employment increased the highest in South Dakota at 0.5%, while Missouri saw the biggest decline at 0.6% between December and January.

Year-over-year ending in January, 2.0 million jobs have been added to the labor market, which is a 1.3% increase compared to the January 2024 level. The range of job gains spanned from 400 jobs in Massachusetts to 187,700 jobs in Texas across 48 states. Two states and the District of Columbia lost a total of 14,800 jobs in the past 12 months, with Arizona reporting the steepest job losses at 10,200. In percentage terms, the range of job growth spanned 2.8% in Alaska to 0.1% in California. Massachusetts was unchanged while District of Columbia, Arizona, and West Virginia declined by 0.1%, 0.3%, 0.5% respectively.

Construction Employment

Across the nation, construction sector jobs data —which includes both residential and non-residential construction—showed that 23 states reported an increase in January compared to December, while 21 states lost construction sector jobs. The six remaining states and the District of Columbia reported no change on a month-over-month basis. Utah, with the highest increase, added 3,300 construction jobs, while Florida, on the other end of the spectrum, lost 5,100 jobs. Overall, the construction industry added a net 2,000 jobs in January compared to the previous month. In percentage terms, Idaho reported the highest increase at 4.0% and Arkansas reported the largest decline at 1.6%.

Year-over-year, construction sector jobs in the U.S. increased by 178,000, which is a 2.2% increase compared to the January 2024 level. Texas added 19,800 jobs, which was the largest gain of any state, while California lost 27,600 construction sector jobs. In percentage terms, Idaho had the highest annual growth rate in the construction sector at 11.1%. Over this period, Massachusetts reported the largest decline of 3.9%.

Discover more from Eye On Housing

Subscribe to get the latest posts sent to your email.


This article was originally published by a eyeonhousing.org . Read the Original article here. .

Nonfarm payroll employment increased in 42 states and the District of Columbia in December compared to the previous month, while it decreased in seven states. Wyoming reported no change during this time. According to the Bureau of Labor Statistics, nationwide total nonfarm payroll employment increased by 256,000 in December, following a gain of 212,000 jobs in November.

On a month-over-month basis, employment data was most favorable in Texas, which added 37,500 jobs. Florida came in second (+18,000), followed by California (+15,000). A total of 8,000 jobs were lost across seven states, with Oregon reporting the steepest job losses at 3,700. In percentage terms, employment increased the highest in Missouri at 0.4%, while Vermont saw the biggest decline at 0.2% between November and December.

Year-over-year ending in December, 2.2 million jobs have been added to the labor market across 48 states and the District of Columbia. This is a 1.4% increase compared to the December 2023 level. West Virginia reported no change, while South Dakota lost 1,000 jobs. The range of job gains spanned from 2,000 jobs in Maine to 284,200 jobs in Texas. In percentage terms, the range of job growth spanned 3.6% in Idaho to 0.3% in Maine. South Dakota declined by 0.2%.

Across the nation, construction sector jobs data —which includes both residential and non-residential construction—showed that 26 states reported an increase in December compared to November, while 20 states lost construction sector jobs. The four remaining states and the District of Columbia reported no change on a month-over-month basis. Washington, with the highest increase, added 4,000 construction jobs, while New York, on the other end of the spectrum, lost 4,400 jobs. Overall, the construction industry added a net 8,000 jobs in December compared to the previous month. In percentage terms, South Dakota reported the highest increase at 1.9% and Mississippi reported the largest decline at 2.2%.

Year-over-year, construction sector jobs in the U.S. increased by 196,000, which is a 2.4% increase compared to the December 2023 level. Texas added 31,500 jobs, which was the largest gain of any state, while California lost 12,400 construction sector jobs. In percentage terms, Alaska had the highest annual growth rate in the construction sector at 18.9%. Over this period, West Virginia reported the largest decline of 3.4%.

Discover more from Eye On Housing

Subscribe to get the latest posts sent to your email.


This article was originally published by a eyeonhousing.org . Read the Original article here. .


Nonfarm payroll employment increased in 38 states and the District of Columbia in November compared to the previous month, while it decreased in 12 states. According to the Bureau of Labor Statistics, nationwide total nonfarm payroll employment increased by 227,000 in November, following a meager gain of 32,000 jobs in October.

On a month-over-month basis, employment data was most favorable in Florida, which added 61,500 jobs, rebounding from the hurricanes that hit the sunshine state in October. Washington came in second (+30,900), followed by North Carolina (+15,000). A total of 20,300 jobs were lost across 12 states, with Colorado reporting the steepest job losses at 3,900. In percentage terms, employment increased the highest in Washington at 0.9%, while Vermont saw the biggest decline at 0.3% between October and November.

Year-over-year ending in November, 2.3 million jobs have been added to the labor market across 49 states and the District of Columbia. This is a 1.4% increase compared to November 2023 level. South Dakota reported no change. The range of job gains spanned from 2,900 jobs in West Virginia to 274,300 jobs in Texas. In percentage terms, the range of job growth spanned 3.1% in Idaho to 0.3% in Iowa.

Across the nation, construction sector jobs data —which includes both residential and non-residential construction—showed that 23 states and the District of Columbia reported an increase in November compared to October, while 23 states lost construction sector jobs. The four remaining states reported no change on a month-over-month basis. Florida, with the highest increase, added 7,600 construction jobs, while Indiana, on the other end of the spectrum, lost 3,400 jobs. Overall, the construction industry added a net 10,000 jobs in November compared to the previous month. In percentage terms, Minnesota reported the highest increase at 2.1% and Indiana reported the largest decline at 2.0%.

Year-over-year, construction sector jobs in the U.S. increased by 211,000, which is a 2.6% increase compared to the November 2023 level. Texas added 32,200 jobs, which was the largest gain of any state, while California lost 11,500 construction sector jobs. In percentage terms, Alaska had the highest annual growth rate in the construction sector at 20.3%. Over this period, Maryland reported the largest decline of 2.3%.

Discover more from Eye On Housing

Subscribe to get the latest posts sent to your email.


This article was originally published by a eyeonhousing.org . Read the Original article here. .


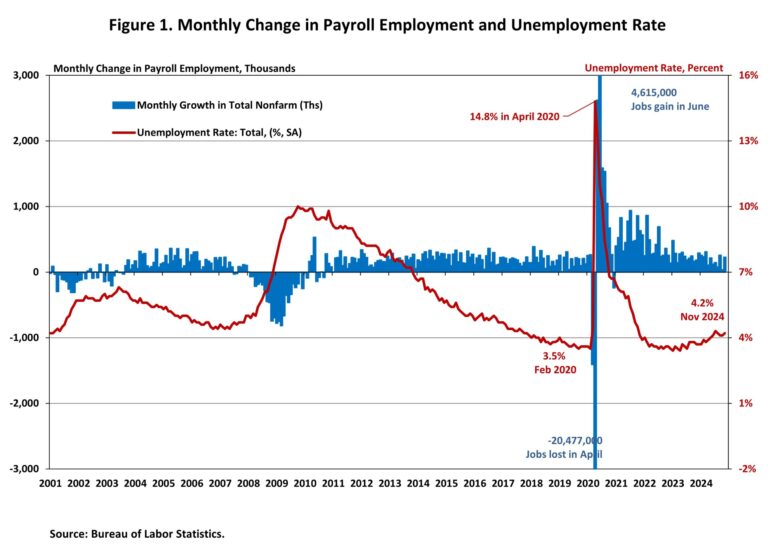
Employment rebounded sharply in November after strike- and hurricane-related disruptions in October. The unemployment rate rose one percentage point to 4.2% after holding at 4.1% for two months in a row.

In November, wage growth remained unchanged from the previous month. Wages grew at a 4.0% year-over-year (YOY) growth rate, down 0.2 percentage points from a year ago. Wage growth is outpacing inflation, which typically occurs as productivity increases.

National Employment

According to the Employment Situation Summary reported by the Bureau of Labor Statistics (BLS), total nonfarm payroll employment rose by 227,000 in November, a sharp rebound from an upwardly revised increase of 36,000 jobs in October. Since January 2021, the U.S. job market has added jobs for 47 consecutive months, making it the third-longest period of employment expansion on record.

The estimates for the previous two months were revised higher. The monthly change in total nonfarm payroll employment for September was revised up by 32,000, from +223,000 to +255,000, while the change for October was revised up by 24,000 from +12,000 to +36,000. Combined, the revisions were 56,000 higher than previously reported.

In the first eleven months of 2024, 1,984,000 jobs were created. Additionally, monthly employment growth averaged 180,000 per month, compared to the 251,000 monthly average gain for 2023. The U.S. economy has created more than 8 million jobs since March 2022, when the Fed enacted the first interest rate hike of this cycle.

The unemployment rate ticked up to 4.2% in November, marking the seventh month that the unemployment rate has been at or above 4.0%. While the number of employed persons decreased by 355,000, the number of unemployed persons rose by 161,000.

Meanwhile, the labor force participation rate—the proportion of the population either looking for a job or already holding a job—decreased by one percentage point to 62.5%. However, for people aged between 25 and 54, the participation rate remained at 83.5% for the second straight month. While the overall labor force participation rate remains below its pre-pandemic levels of 63.3% at the beginning of 2020, the rate for people aged between 25 and 54 exceeds the pre-pandemic level of 83.1%.

In November, employment continued to trend up in health care (+54,000), leisure and hospitality (+53,000), government (+33,000), and social assistance (+19,000). Employment in transportation equipment manufacturing increased in November as workers who were on strike returned to work. Meanwhile, retail trade lost 28,000 jobs.

Construction Employment

Employment in the overall construction sector increased by 10,000 in November, after 2,000 gains in October. While residential construction gained 3,100 jobs, non-residential construction employment added 6,800 jobs for the month.

Residential construction employment now stands at 3.4 million in November, broken down as 958,000 builders and 2.4 million residential specialty trade contractors. The 6-month moving average of job gains for residential construction was 2,983 a month. Over the last 12 months, home builders and remodelers added 52,400 jobs on a net basis. Since the low point following the Great Recession, residential construction has gained 1,391,400 positions.

In November, the unemployment rate for construction workers remained at 5.3% on a seasonally adjusted basis. The unemployment rate for construction workers has remained at a relatively lower level, after reaching 15.3% in April 2020 due to the housing demand impact of the COVID-19 pandemic.

Discover more from Eye On Housing

Subscribe to get the latest posts sent to your email.


This article was originally published by a eyeonhousing.org . Read the Original article here. .


Clouded by hurricanes in the southeast part of the country and strike activity in the manufacturing sector, October nonfarm payroll figures were mediocre. Nonfarm payroll employment increased in 21 states in October compared to the previous month, while it decreased in 29 states and the District of Columbia. According to the Bureau of Labor Statistics, nationwide total nonfarm payroll employment increased by a meager 12,000 in October, following a gain of 223,000 jobs in September.

On a month-over-month basis, employment data was most favorable in Colorado, which added 9,000 jobs. Louisiana came in second (+7,700), followed by Ohio (+6,400). A total of 144,500 jobs were lost across 29 states and the District of Columbia, with Florida reporting the steepest job losses at 38,000. Washington lost 35,900 jobs while New York lost a total of 10,900 jobs. In percentage terms, employment increased the highest in South Dakota at 0.4%, while Washington saw the biggest decline at 1.0% between September and October.

Year-over-year ending in October, 2.2 million jobs have been added to the labor market across all 50 states and the District of Columbia. This is a 1.4% increase compared to October 2023 level. The range of job gains spanned from 2,800 jobs in Wyoming to 274,600 jobs in Texas. In percentage terms, the range of job growth spanned 3.1% in Idaho to 0.4% in Washington.

Across the nation, construction sector jobs data —which includes both residential and non-residential construction—showed that 33 states and the District of Columbia reported an increase in October compared to September, while 13 states lost construction sector jobs. The four remaining states reported no change on a month-over-month basis. Louisiana, with the highest increase, added 3,400 construction jobs, while Florida, on the other end of the spectrum, lost 5,400 jobs. Overall, the construction industry added a net 8,000 jobs in October compared to the previous month. In percentage terms, Louisiana reported the highest increase at 2.5% and Iowa reported the largest decline at 2.1%.

Year-over-year, construction sector jobs in the U.S. increased by 223,000, which is a 2.8% increase compared to the October 2023 level. Texas added 38,800 jobs, which was the largest gain of any state, while New York lost 9,200 construction sector jobs. In percentage terms, Alaska had the highest annual growth rate in the construction sector at 19.1%. Over this period, Oregon reported the largest decline of 4.3%.

Discover more from Eye On Housing

Subscribe to get the latest posts sent to your email.


This article was originally published by a eyeonhousing.org . Read the Original article here. .

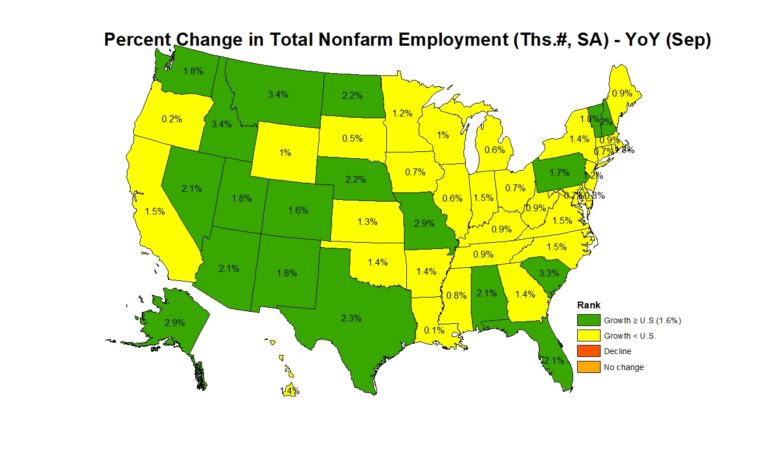
Nonfarm payroll employment increased in 41 states and the District of Columbia in September compared to the previous month, while eight states saw a decrease. Nevada reported no change. According to the Bureau of Labor Statistics, nationwide total nonfarm payroll employment increased by 254,000 in September, following a gain of 159,000 jobs in August.

On a month-over-month basis, employment data was most favorable in Texas, which added 29,200 jobs. New Jersey came in second (+19,200), followed by Florida (+17,000). A total of 17,400 jobs were lost across eight states, with Iowa reporting the steepest job losses at 4,800. In percentage terms, employment increased the highest in Idaho at 0.7%, while Iowa saw the biggest decline at 0.3% between August and September.

Year-over-year ending in September, 2.4 million jobs have been added to the labor market across all 50 states and the District of Columbia. The range of job gains spanned from 2,000 jobs in Louisiana to 327,400 jobs in Texas. In percentage terms, the range of job growth spanned 3.4% in Idaho to 0.1% in Louisiana.

Across the nation, construction sector jobs data   —which includes both residential and non-residential construction—showed that 24 states and the District of Columbia reported an increase in September compared to August, while 23 states lost construction sector jobs. The three remaining states reported no change on a month-over-month basis. Texas, with the highest increase, added 8,100 construction jobs, while Tennessee, on the other end of the spectrum, lost 1,600 jobs. Overall, the construction industry added a net 25,000 jobs in September compared to the previous month. In percentage terms, Ohio reported the highest increase at 2.7% and North Dakota reported the largest decline at 2.1%.

Year-over-year, construction sector jobs in the U.S. increased by 238,000, which is a 3.0% increase compared to the September 2023 level. Texas added 42,300 jobs, which was the largest gain of any state, while New York lost 6,900 construction sector jobs. In percentage terms, Alaska had the highest annual growth rate in the construction sector at 21.1%. Over this period, Oregon reported the largest decline of 4.1%.

Discover more from Eye On Housing

Subscribe to get the latest posts sent to your email.


This article was originally published by a eyeonhousing.org . Read the Original article here. .


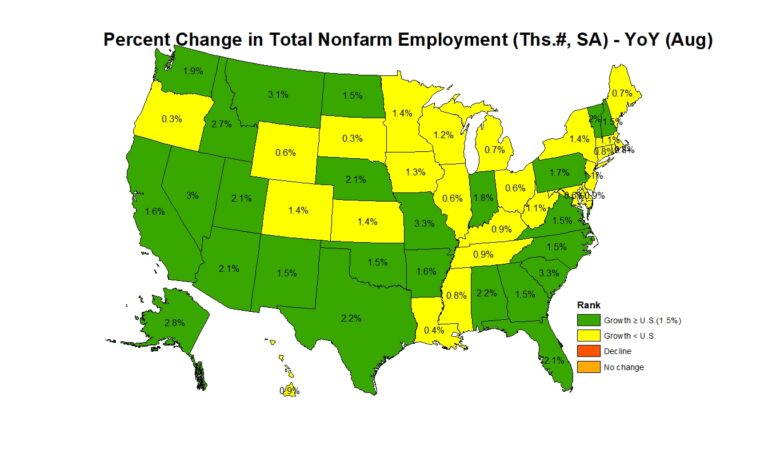
Nonfarm payroll employment increased in 32 states in August compared to the previous month, while 17 states and the District of Columbia saw a decrease. Kansas reported no change. According to the Bureau of Labor Statistics, nationwide total nonfarm payroll employment increased by 142,000 in August, following a gain of 89,000 jobs in July.

On a month-over-month basis, employment data was most favorable in Texas, which added 78,000 jobs. Texas accounted for more than half the jobs created nationwide in August. Indiana came in second (+19,800), followed by Minnesota (+14,400). A total of 42,400 jobs were lost across the 17 states and the District of Columbia, with New York reporting the steepest job losses at 7,400. In percentage terms, employment increased the highest in Texas and Indiana at 0.6%, while South Dakota saw the biggest decline at 0.7% between July and August.

Year-over-year ending in August, 2.4 million jobs have been added to the labor market across all 50 states and the District of Columbia. The range of job gains spanned from 1,500 jobs in South Dakota to 302,400 jobs in Texas. In percentage terms, the range of job growth spanned 3.3% in Missouri to 0.3% in South Dakota.

Across the nation, construction sector jobs data1 —which includes both residential and non-residential construction—showed that 27 states and the District of Columbia reported an increase in August compared to July, while 20 states lost construction sector jobs. The three remaining states reported no change on a month-over-month basis. Texas, with the highest increase, added 8,300 construction jobs, while California, on the other end of the spectrum, lost 3,300 jobs. Overall, the construction industry added a net 34,000 jobs in August compared to the previous month. In percentage terms, Wyoming reported the highest increase at 2.3% and Tennessee reported the largest decline at 1.6%.

Year-over-year, construction sector jobs in the U.S. increased by 228,000, which is a 2.8% increase compared to the August 2023 level. Texas added 36,600 jobs, which was the largest gain of any state, while Maryland lost 4,800 construction sector jobs. In percentage terms, Alaska had the highest annual growth rate in the construction sector at 17.8%. Over this period, Maine reported the largest decline of 4.7%.

Discover more from Eye On Housing

Subscribe to get the latest posts sent to your email.


This article was originally published by a eyeonhousing.org . Read the Original article here. .

Nonfarm payroll employment increased in 28 states in July compared to the previous month, while 22 states saw a decrease. The District of Columbia reported no change. According to the Bureau of Labor Statistics, nationwide total nonfarm payroll employment increased by 114,000 in July, following a gain of 179,000 jobs in June.

On a month-over-month basis, employment data was most favorable in New York, which added 41,400 jobs, followed by Florida (+21,800), and then California (+21,100). A total of 81,700 jobs were lost across the 22 states, with Missouri reporting the steepest job losses at 22,400. In percentage terms, employment increased the highest in Vermont at 0.5%, while Missouri saw the biggest decline at 0.7% between June and July.

Year-over-year ending in July, 2.5 million jobs have been added to the labor market across all 50 states and the District of Columbia. The range of job gains spanned from 1,900 jobs in Wyoming to 284,400 jobs in California. In percentage terms, the range of job growth spanned 3.7% in South Carolina to 0.4% in Oregon.

Across the nation, construction sector jobs data[1]—which includes both residential and non-residential construction—showed that 29 states and the District of Columbia reported an increase in July compared to June, while 16 states lost construction sector jobs. The five remaining states reported no change on a month-over-month basis. Florida, with the highest increase, added 6,300 construction jobs, while New York, on the other end of the spectrum, lost 3,800 jobs. Overall, the construction industry added a net 25,000 jobs in July compared to the previous month. In percentage terms, Tennessee reported the highest increase at 3.3% and Arkansas reported the largest decline at 1.2%.

Year-over-year, construction sector jobs in the U.S. increased by 239,000, which is a 3.0% increase compared to the July 2023 level. Florida added 36,700 jobs, which was the largest gain of any state, while New York lost 8,100 construction sector jobs. In percentage terms, Alaska had the highest annual growth rate in the construction sector at 19.9%. Over this period, Maine reported the largest decline of 4.1%.

[1] For this analysis, BLS combined employment totals for mining, logging, and construction are treated as construction employment for the District of Columbia, Delaware, and Hawaii.

Discover more from Eye On Housing

Subscribe to get the latest posts sent to your email.


This article was originally published by a eyeonhousing.org . Read the Original article here. .
Pin It