Tag

Economy

Browsing


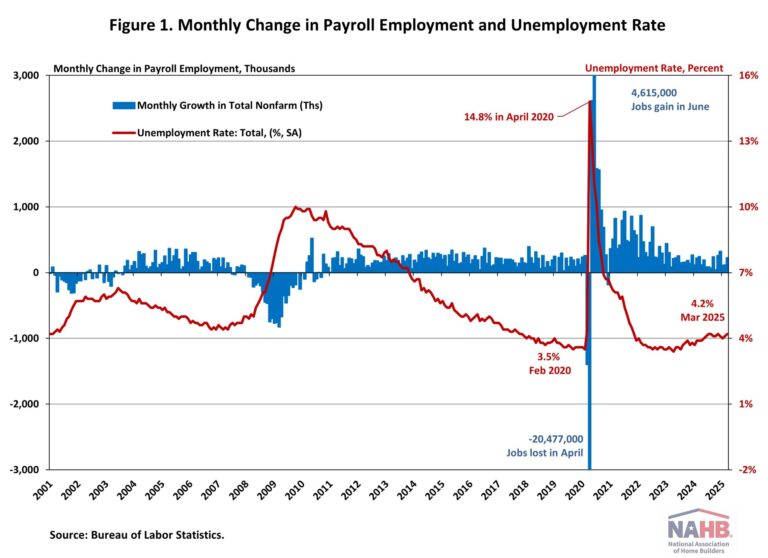
The U.S. job market unexpectedly accelerated in March, while the figures for January and February were revised downward substantially. The unemployment rate ticked up slightly to 4.2% in March, from 4.1% the previous month. This month’s jobs report highlights the continued resilience of the labor market despite sticky inflation, a drop in consumer confidence, mass federal government layoffs, and growing economic uncertainty.

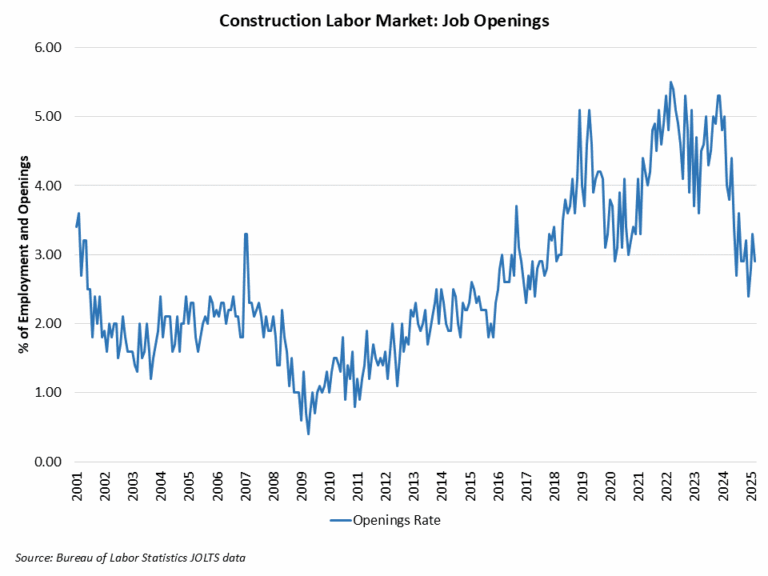
Noticeably, residential construction employment has shown signs of weakness in recent months. In March, the six-month moving average of job gains for residential construction turned negative for the first time since August 2020. It reflects three significant drops in employment: 8,400 jobs in October 2024, 6,700 jobs in January 2025, and 9,800 jobs in March 2025. Additionally, the construction job openings rate has returned to 2019 levels, driven by a slowdown in construction activity.

In March, wage growth slowed. Year-over-year, wages grew at a 3.8% rate, down 0.3 percentage points from a year ago. Wage growth has been outpacing inflation for nearly two years, which typically occurs as productivity increases.

National Employment

According to the Employment Situation Summary reported by the Bureau of Labor Statistics (BLS), total nonfarm payroll employment rose by 228,000 in March, following a downwardly revised increase of 117,000 jobs in February. Since January 2021, the U.S. job market has added jobs for 51 consecutive months, making it the third-longest period of employment expansion on record.

The estimates for the previous two months were revised down. The monthly change in total nonfarm payroll employment for January was revised down by 14,000 from +125,000 to +111,000, while the change for February was revised down by 34,000 from +151,000 to +117,000. Combined, the revisions were 48,000 lower than previously reported.

The unemployment rate rose to 4.2% in March. While the number of employed persons increased by 201,000, the number of unemployed persons increased by 31,000.

Meanwhile, the labor force participation rate—the proportion of the population either looking for a job or already holding a job—rose one percentage point to 62.5%. For people aged between 25 and 54, the participation rate decreased two percentage points to 83.3%. While the overall labor force participation rate remains below its pre-pandemic levels of 63.3% at the beginning of 2020, the rate for people aged between 25 and 54 has been trending down since it peaked at 83.9% last summer.

In March, employment rose in health care (+54,000), social assistance (+24,000), and transportation and warehousing (+23,000). Employment in retail trade also added 24,000 jobs in March, partially reflecting the return of workers from a strike. However, within the government sector, federal government employment saw a decline of 4,000, following a loss of 11,000 jobs in February. The BLS notes that “employees on paid leave or receiving ongoing severance pay are counted as employed in the establishment survey.”

Construction Employment

Employment in the overall construction sector increased by 13,000 in March, following a gain of 14,000 in February. While residential construction saw a decline of 9,800 jobs, non-residential construction employment added 22,300 jobs for the month.

Residential construction employment now stands at 3.4 million in March, broken down as 958,000 builders and 2.4 million residential specialty trade contractors. The six-month moving average of job gains for residential construction was -2,883 a month, mainly reflecting the three months’ job loss over the past six months (October 2024, January 2025 and March 2025). Over the last 12 months, home builders and remodelers added 14,000 jobs on a net basis. Since the low point following the Great Recession, residential construction has gained 1,367,600 positions.

In March, the unemployment rate for construction workers declined to 4.3% on a seasonally adjusted basis. The unemployment rate for construction workers has remained at a relatively lower level, after reaching 15.3% in April 2020 due to the housing demand impact of the COVID-19 pandemic.

Discover more from Eye On Housing

Subscribe to get the latest posts sent to your email.


This article was originally published by a eyeonhousing.org . Read the Original article here. .


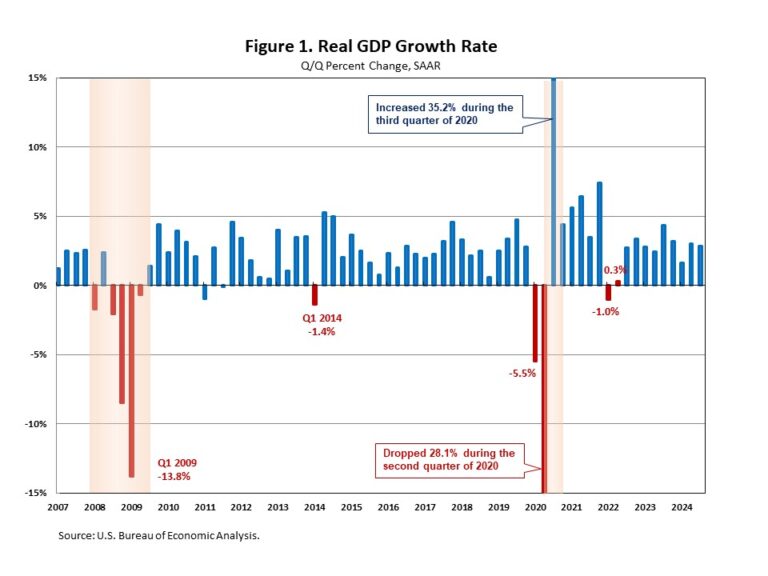
Real GDP growth slowed in the fourth quarter of 2024, but the economy finished the year at a solid rate. While consumer spending continued to drive growth, gross private domestic investment detracted over a full percentage point mainly due to a decline in private inventories.

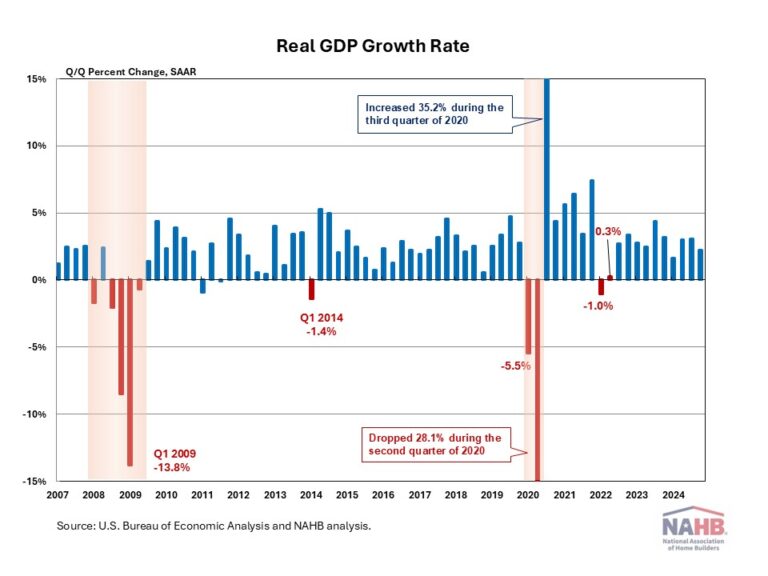
According to the “advance” estimate released by the Bureau of Economic Analysis (BEA), real gross domestic product (GDP) expanded at an annual rate of 2.3% in the fourth quarter of 2024, following a 3.1% gain in the third quarter of 2024. This quarter’s growth was higher than NAHB’s forecast of a 1.8% increase.

Furthermore, the data from the GDP report suggests that inflationary pressure persisted at the end of 2024. The GDP price index rose 2.2% for the fourth quarter, up from a 1.9% increase in the third quarter of 2024. The Personal Consumption Expenditures Price (PCE) Index, which measures inflation (or deflation) across various consumer expenses and reflects changes in consumer behavior, rose 2.3% in the fourth quarter. This is up from a 1.5% increase in the third quarter of 2024.

For the full year, real GDP grew at a healthy rate of 2.8% in 2024. It was slightly slower than the 2023 level of a 2.9% increase and matched NAHB’s forecast.

This quarter’s increase in real GDP primarily reflected increases in consumer spending, and government spending.

Consumer spending, the backbone of the U.S. economy, rose at an annual rate of 4.2% in the fourth quarter. This marks the highest annual growth rate since the first quarter of 2023. The increase in consumer spending reflected increases in both goods and services. While goods spending increased at a 6.6% annual rate, expenditures for services increased at a 3.1% annual rate.

In the fourth quarter, government spending increased at a 2.5% rate.

Nonresidential fixed investment decreased 2.2% in the fourth quarter. The decrease in nonresidential fixed investment reflected decreases in equipment (-7.8%) and structures (-1.1%). Meanwhile, residential fixed investment increased 5.3% in the fourth quarter after two consecutive quarters of declines. Within residential fixed investment, single-family structures rose 3.1% at an annual rate, improvements increased 2.7%, while multifamily structures declined 7.2%.

Compared to the third quarter, the deceleration in real GDP in the fourth quarter primarily reflected

downturns in gross private domestic investment and exports. Inventories fell and dragged down the contribution to real GDP by 0.93 percentage points. Imports decreased.

For the common BEA terms and definitions, please access bea.gov/Help/Glossary.

Discover more from Eye On Housing

Subscribe to get the latest posts sent to your email.


This article was originally published by a eyeonhousing.org . Read the Original article here. .


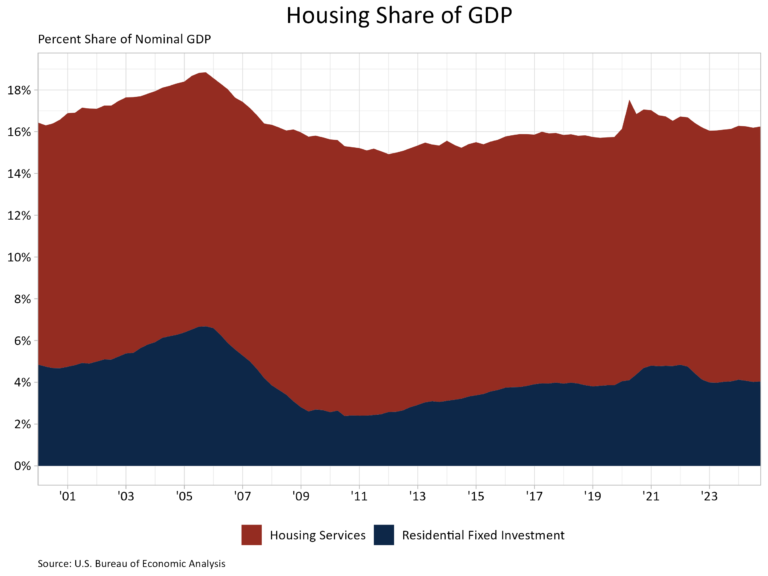
Housing’s share of the economy remained unchanged at 16.2% in the fourth quarter of 2024, according to the advance estimate of GDP produced by the Bureau of Economic Analysis. For the year, housing’s share of the economy was 16.2%, up from 16.0% in 2023 and down from 16.5% in 2022.

The more cyclical home building and remodeling component – residential fixed investment (RFI) – was 4.0% of GDP, level with the previous quarter. The second component – housing services – was 12.2% of GDP, also level with the previous quarter. The graph below stacks the nominal shares for housing services and RFI, resulting in housing’s total share of the economy.

Housing service growth is much less volatile when compared to RFI due to the cyclical nature of RFI. Historically, RFI has averaged roughly 5% of GDP while housing services have averaged between 12% and 13%, for a combined 17% to 18% of GDP. These shares tend to vary over the business cycle. However, the housing share of GDP lagged during the post-Great Recession period due to underbuilding, particularly for the single-family sector.

In the fourth quarter, RFI added 21 basis points from the headline GDP growth rate in the fourth quarter of 2024, a welcomed result as RFI previously had two consecutive quarters of negative contributions to GDP. The Federal Reserve, while keeping unchanged this month, lowered the federal funds rate by 100 basis points in September and December of 2024. This likely improved financing conditions for many builders, leading to RFI’s growth in the fourth quarter. A notable observation from the fourth quarter release was nonresidential fixed investment (similar to RFI, but for nonresidential structures) negatively contributed 31 basis points to GDP growth, the first negative effect on the economy for nonresidential fixed investment in over three years.

Housing services added 17 basis points (bps) to GDP growth.  Among household expenditures for services, housing services contributions were the fourth-highest contributor to headline GDP growth behind health care (46 bps), other services (31 bps) and financial services and insurance (18 bps).

Overall GDP increased at a 2.3% annual rate, down from a 3.1% increase in the third quarter of 2024, and down from a 3.0% increase in the second quarter of 2024. Headline GDP growth in 2024 was 2.8%, down slightly from 2.9% in 2023 but up from 2.5% in 2022.

Housing-related activities contribute to GDP in two basic ways:

The first is through residential fixed investment (RFI). RFI is effectively the measure of home building, multifamily development, and remodeling contributions to GDP. RFI consists of two specific types of investment, the first is residential structures. This investment includes construction of new single-family and multifamily structures, residential remodeling, production of manufactured homes, brokers’ fees and some types of equipment that are built into the structure. RFI’s second component, residential equipment, includes investment such as furniture or household appliances that are purchased by landlords for rental to tenants.

For the fourth quarter, RFI was 4.0% of the economy, recording a $1.200 trillion seasonally adjusted annual pace. RFI grew 5.3% at an annual rate in the fourth quarter after falling 4.4% in the third. Among the two types of RFI, real investment in residential structures rose 5.3% while for residential equipment it rose 4.9%. Investment in residential structures stood at a seasonally adjusted annual pace of $1.178 trillion, making its share of residential investment far greater than that of residential equipment, which was at seasonally adjusted annual pace of $21.5 billion.

The second impact of housing on GDP is the measure of housing services. Similar to the RFI, housing services consumption can be broken out into two components. The first component, housing, includes gross rents paid by renters, owners’ imputed rent (an estimate of how much it would cost to rent owner-occupied units), rental value of farm dwellings, and group housing. The inclusion of owners’ imputed rent is necessary from a national income accounting approach, because without this measure, increases in homeownership would result in declines in GDP. The second component, household utilities, is composed of consumption expenditures on water supply, sanitation, electricity, and gas.

For the fourth quarter, housing services represented 12.2% of the economy or $3.625 trillion on a seasonally adjusted annual basis. Housing services grew 1.4% at an annual rate in the fourth quarter. Real person consumption expenditures for housing also grew 1.4%, while household utilities expenditures grew 1.6%. At the seasonally adjusted annual pace, housing expenditures was $3.166 trillion and household utility expenditures stood at $458.9 billion in seasonally adjusted annual rates.

Discover more from Eye On Housing

Subscribe to get the latest posts sent to your email.


This article was originally published by a eyeonhousing.org . Read the Original article here. .


The U.S. economy grew at a solid pace in the third quarter of 2023, boosted by strong consumer spending and government spending. According to the “advance” estimate released by the Bureau of Economic Analysis (BEA), real gross domestic product (GDP) expanded at an annual rate of 2.8% in the third quarter of 2024, following a 3.0% gain in the second quarter of 2024. This quarter’s growth matched NAHB’s forecast.

Furthermore, the data from the GDP report suggests that inflation is cooling. The GDP price index rose 1.8% for the third quarter, down from a 2.5% increase in the second quarter of 2024. The Personal Consumption Expenditures Price (PCE) Index, which measures inflation (or deflation) across various consumer expenses and reflects changes in consumer behavior, rose 1.5% in the third quarter. This is down from a 2.5% increase in the second quarter of 2024.

This quarter’s increase in real GDP primarily reflected increases in consumer spending, exports, and federal government spending.

Consumer spending, the backbone of the U.S. economy, rose at an annual rate of 3.7% in the third quarter. It marks the highest annual growth rate since the first quarter of 2023. The increase in consumer spending reflected increases in both goods and services. While goods spending increased at a 6.0% annual rate, expenditures for services increased 2.6% at an annual rate.

The U.S. trade deficit increased in the third quarter, as imports increased more than exports. A wider trade deficit shaved 0.56 percentage points off GDP. Imports, which are a subtraction in the calculation of GDP, increased 11.2%, while exports rose 8.9%.

In the third quarter, federal government spending increased 9.7%, led by a 14.9% surge in national defense outlays.

Nonresidential fixed investment increased 3.3% in the third quarter. Increases in equipment and intellectual property products were partly offset by a decrease in structures. Meanwhile, residential fixed investment decreased 5.1% in the third quarter and dragged down the contribution to real GDP by 0.21 percentage points. Within residential fixed investment, single-family structures declined 16.1% at an annual rate, multifamily structures decreased 8.7%, while improvements rose 13.9%.

For the common BEA terms and definitions, please access bea.gov/Help/Glossary.

Discover more from Eye On Housing

Subscribe to get the latest posts sent to your email.


This article was originally published by a eyeonhousing.org . Read the Original article here. .


How new real estate rules are set to reshape home buying and selling across the U.S. – CBS News

Watch CBS News

Starting Aug. 17, new regulations will change how real estate commissions are handled, potentially lowering costs for homebuyers and sellers. Under the new rules, buyers and sellers will have the opportunity to negotiate commissions directly with their agents, a shift that could impact everyone involved in the real estate market.

Be the first to know

Get browser notifications for breaking news, live events, and exclusive reporting.

Not Now
Turn On


This article was originally published by a www.cbsnews.com . Read the Original article here. .

Pin It