Tag

Decline

Browsing


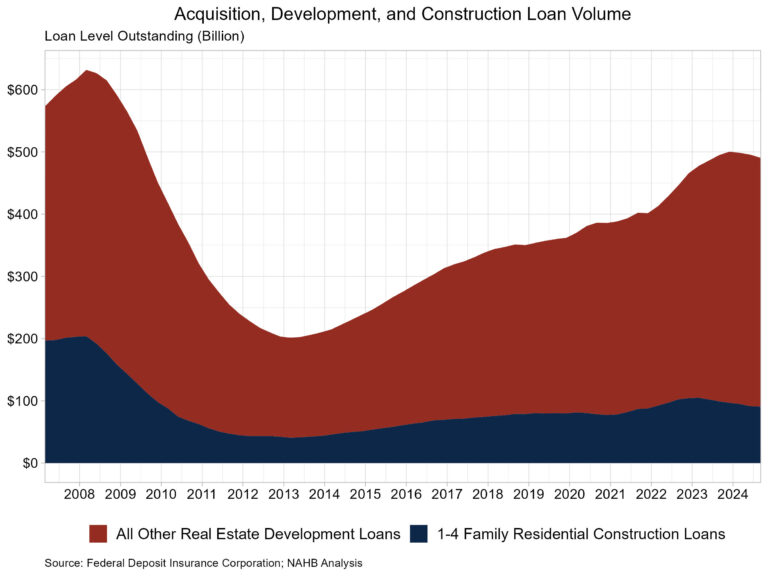
The total volume of outstanding acquisition, development, and construction (AD&C) loans made by FDIC-insured institutions fell for the third consecutive quarter during the third quarter of 2024 to a volume of $490.7 billion, down from $495.8 billion in the second quarter. Interest rates remained higher over the third quarter, as the Fed issued its first rate cut at the end of the quarter in September. Future AD&C lending conditions are poised to improve as the Fed continues its easing cycle over the next year despite potential headwinds of higher Government deficits and economic uncertainty.

The volume of 1-4 family residential construction and land development loans totaled $90.8 billion in the third quarter, down 8.4% from one year ago. This year-over-year decline marked the fifth straight quarter where the total volume of outstanding loans declined compared to a year prior. All other real estate development loans totaled $399.9 billion in the third quarter, down $4.3 billion from the previous quarter.

It is worth noting, the FDIC data represent only the stock of loans, not changes in the underlying flows, so it is an imperfect data source. Lending remains much reduced from years past. The current amount of existing 1-4 family residential AD&C loans now stands 55% lower than the peak level of residential construction lending of $204 billion reached during the first quarter of 2008. Alternative sources of financing, including equity partners, have supplemented this capital market in recent years.

While the volume of 1-4 family residential AD&C loans fell during the third quarter, the volume of past due and nonaccrual residential AD&C loans rose above $1 billion for the first time since 2014. A majority of this outstanding total was made up of loans in nonaccrual status (typically a loan where the lender does not expect to receive payment) which totaled $505.9 million. The outstanding loan balance for those 30-89 days past due was $491.5 million and loans 90 days or more past due totaled $65.4 million. As a share of the total outstanding stock of 1-4 family residential AD&C loans ($90.8 billion), past due and nonaccrual loans ($1.0 billion) made up 1.2% of the outstanding stock of loans.

Discover more from Eye On Housing

Subscribe to get the latest posts sent to your email.


This article was originally published by a eyeonhousing.org . Read the Original article here. .

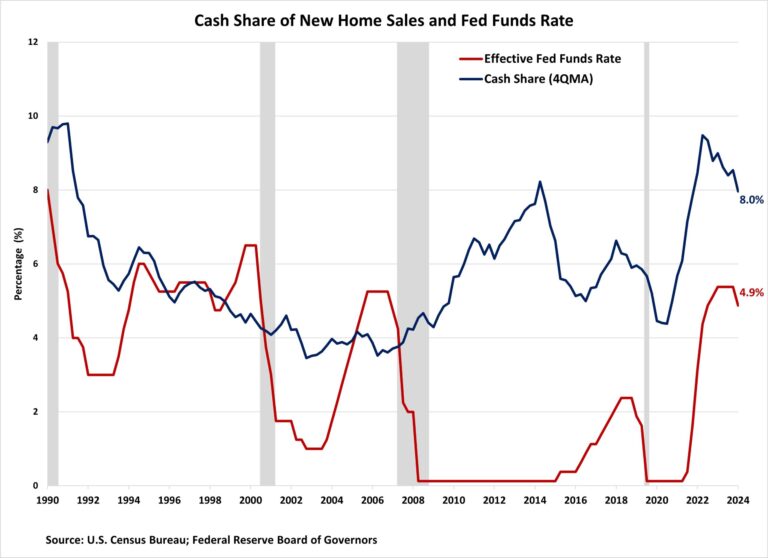
 All-cash purchases accounted for 7.9% of new home sales in the third quarter of 2024, marking the highest level this year but lowest level for the third quarter since 2022, according to NAHB analysis of the latest Census Quarterly Sales by Price and Financing report. Among mortgaged home sales, FHA-backed and VA-backed sales fell while conventional sales increased. This is in line with the overall trend observed in mortgage activity, as mortgage demand grew with moderating rates during this period. Despite the decline in total sales, the median purchase price of new homes (across all financing types) continued to increase in the third quarter.

Since the Federal Reserve began raising interest rates in early 2022, the share of all-cash new home sales has increased significantly, with an average of 8.7% amid this tightening cycle. The interest rate hikes have caused the average mortgage rate to more than double, surging from 3.1% in the fourth quarter of 2021 to 7.0% by the end of second quarter of 2024. The chart below illustrates how much more sensitive the all-cash share has become to changes in the federal funds rate since 2017. However, after peaking at 10.7% in the fourth quarter of 2022, the all-cash share has recently trended lower.

Although cash sales make up a relatively small portion of new home sales, they constitute a larger share of existing home sales. This share also increased significantly since the Fed began raising interest rates in early 2022. According to estimates from the National Association of Realtors, 30% of existing home transactions were all-cash sales in September 2024, up from 26% in August and 29% a year ago.

The share of FHA-backed sales fell from 13.0% to 11.9% in the third quarter of 2024, reaching the lowest level since the fourth quarter of 2022. This share remains below the post-Great Recession average of 17.0%. Meanwhile, the share of VA-backed sales also decreased, falling from 5.4% to 5.1%. Among declines in other types of new home financing, the share of conventional loans financed sales saw an increase in the third quarter of 2024, climbing from 73.9% to 75.1%, the highest level since the fourth quarter of 2022.

Price by Type of Financing

Different sources of financing also serve distinct market segments, which is revealed in part by the median new home price associated with each. In the third quarter, the national median sales price of a new home was $420,400. Split by types of financing, the median prices of new homes financed with conventional loans, FHA loans, VA loans, and cash were $466,100, $352,100, $404,000, and $401,600, respectively.

The purchase price of new homes financed with conventional and cash declined over the past year, while the price of homes financed with FHA loans and VA loans increased. The largest decline occurred in cash sales prices, which fell 21.1% over the year. This is in stark contrast to year-over-year price changes in the third quarter of 2022 and 2023, when median sales price rose 16.9% and 18.2% (see below).

Discover more from Eye On Housing

Subscribe to get the latest posts sent to your email.


This article was originally published by a eyeonhousing.org . Read the Original article here. .

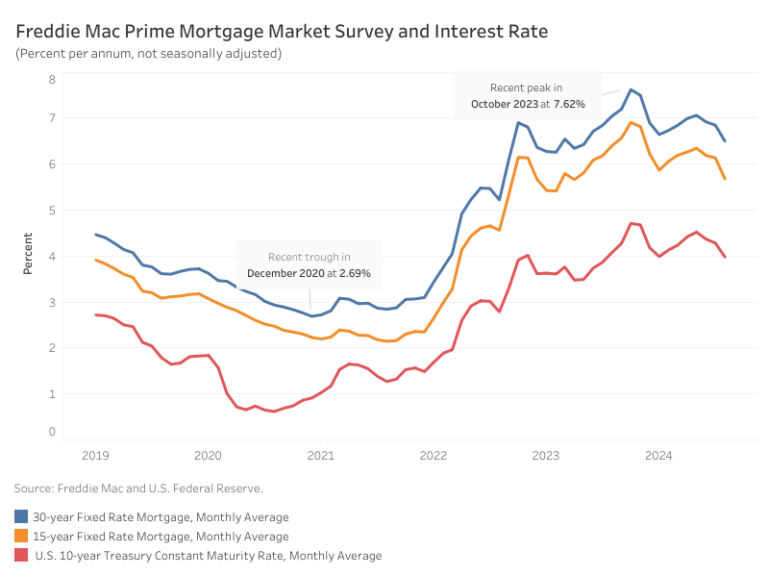
Mortgage rates continued to decrease in August, landing at an average rate of 6.50%. According to Freddie Mac, the average monthly rate fell by 35 basis points (bps) from July’s rate of 6.85%. The August rate is down 57 bps from one year ago, which stood at 7.07%.

The 15-year fixed-rate mortgage also saw a decrease, dropping by 45 bps from July to 5.68%, and is now lower compared to last August by 75 bps. Additionally, the 10-year Treasury rate declined 30 bps from 4.28% in July to 3.98%.

Per the NAHB forecast, we expect 30-year mortgage rates to decline slightly to around 6.66% at the end of 2024 and eventually to decline to just under 6% by the end of 2025. The NAHB outlook anticipates the federal funds rate to be cut by 25 bps no later than the December Federal Reserve meeting, although it is possible for the Fed to cut rates in the upcoming FOMC meeting in September.

Discover more from Eye On Housing

Subscribe to get the latest posts sent to your email.


This article was originally published by a eyeonhousing.org . Read the Original article here. .

Despite high mortgage rates, the lack of resale homes and pent-up demand drove solid growth in single-family permits across nearly all regions in the second quarter. In contrast, multifamily construction permit activity experienced declines across all regions for the second quarter of 2024. These trends are tabulated from the recent release of the National Association of Home Builders’ (NAHB) Home Building Geography Index (HBGI).

Single-Family

All markets for single-family construction saw higher growth in the second quarter compared to the first quarter. In contrast to the second quarter of 2023, which experienced declines across all markets, this year shows a clear reversal. Large metro core counties had the largest growth rate for the second consecutive quarter at 17.6%, while micro counties continued to have the lowest for the third straight quarter, at 3.4%.

Looking at single-family HBGI market shares, small metro core counties continued to have the largest market share at 28.9%. Large metro suburban counties are the only other market with over 20% market share, at 25.0% in the second quarter. The smallest market share continued to be non metro/micro counties at 4.3%. However, this market remains almost a percentage point higher than what it was pre-pandemic in 2019.

Multifamily

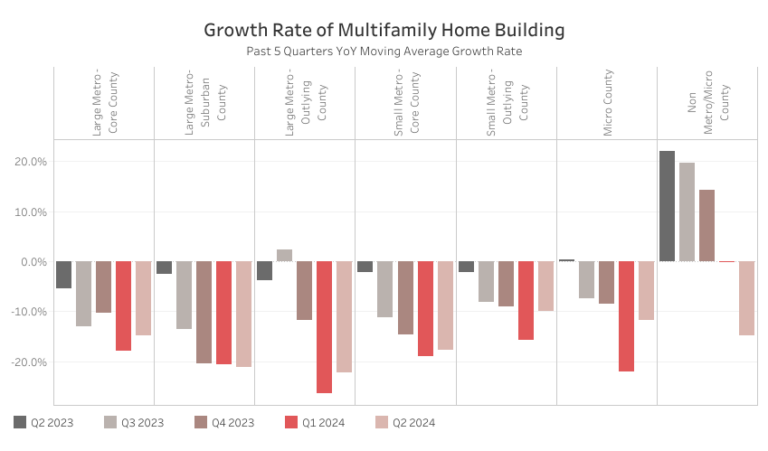
In the multifamily sector, the HBGI year-over-year growth continued to post declines for all markets in the second quarter. This can be contributed to high levels of multifamily units under construction and tighter financial conditions. Only two markets had larger declines than the first quarter, with large metro suburban counties down 21.1% and non metro/micro counties down 14.8%. Notably, non metro/micro counties were the last market to experience a decline in multifamily construction. These counties were an area of growth in the second, third and fourth quarters of last year while all other markets experience declines or negligible growth.

Multifamily market shares in the HBGI remained similar to the first quarter, with large metro core counties having the largest market share at 40.1%. The smallest market was non metro/micro counties, with a 1.1% market share.

The second quarter of 2024 HBGI data along with an interactive HBGI map can be found at http://nahb.org/hbgi.

Discover more from Eye On Housing

Subscribe to get the latest posts sent to your email.


This article was originally published by a eyeonhousing.org . Read the Original article here. .

Mortgage rates continued to decrease in July, landing at an average rate of 6.85%. According to Freddie Mac, the average monthly rate fell by 7 basis points (bps) from June’s rate of 6.92%. This current rate is nearly identical to the rate from one year ago, which stood at 6.84%.

The 15-year fixed-rate mortgage also saw a decrease, dropping by 5 bps from June to 6.14%, and is now lower compared to last July by 4 bps. Additionally, the 10-year Treasury rate declined 9 bps from 4.37% in June to 4.28%.

Per the NAHB forecast, we expect 30-year mortgage rates to decline slightly to around 6.66% at the end of 2024 and eventually to decline to just under 6% by the end of 2025. The NAHB outlook anticipates the federal funds rate to be cut by 25 bps no later than the December Federal Reserve meeting and six more rate cuts in 2025 as inflation approaches the Fed’s policy target.

Discover more from Eye On Housing

Subscribe to get the latest posts sent to your email.


This article was originally published by a eyeonhousing.org . Read the Original article here. .
Pin It