Tag

December

Browsing


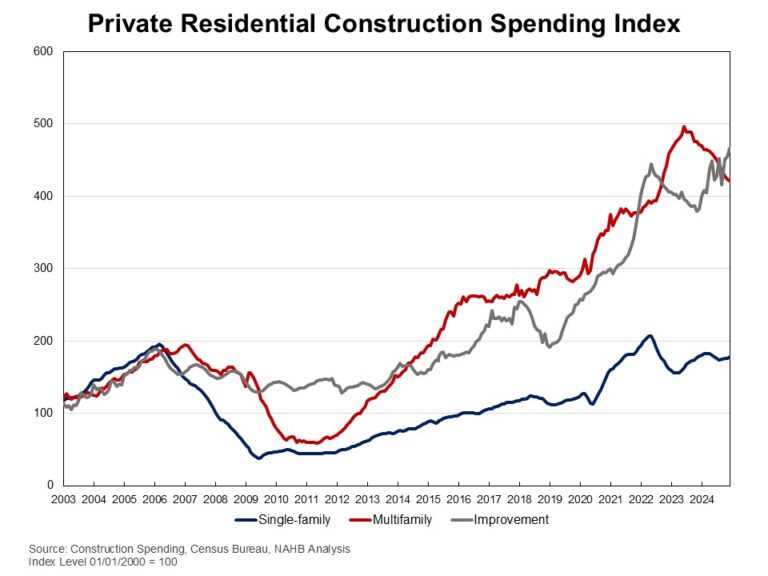
Private residential construction spending increased by 1.5% in December 2024, according to the latest U.S. Census Construction Spending data. It was the third consecutive monthly increase since September 2024.  On a year-over-year basis, the December report showed a 6% increase.

The monthly increase in total private construction spending was primarily driven by higher spending on single-family construction and residential improvements. Single-family construction spending was up 1% for the month. This marks a continuation of growth after a five-month decline from April to August, aligning with steady builder confidence seen in the Housing Market Index. However, single-family construction remained 0.8% lower than a year ago. Improvement spending rose by 2.6% in December and was 21.9% higher compared to the same period last year. In contrast, multifamily construction spending edged down 0.3% in December, following an 8.4% increase in October and a 0.8% up in November. Compared to a year ago, multifamily construction spending was still 10.5% lower.

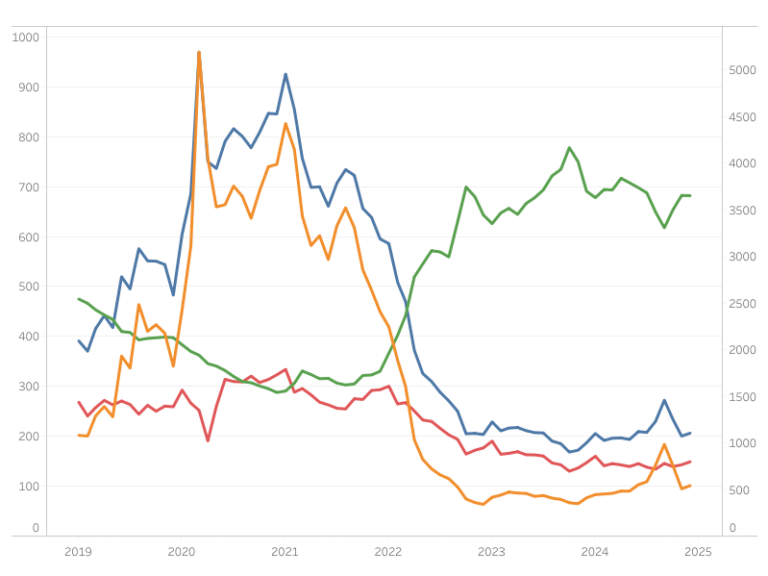
The NAHB construction spending index is shown in the graph below. The index illustrates how   spending on single-family construction has slowed since early 2024 under the pressure of elevated interest rates. Multifamily construction spending growth has also slowed down after the peak in July 2023. Meanwhile, improvement spending has increased its pace since late 2023.

Spending on private nonresidential construction was up 2.3% over a year ago. The annual private nonresidential spending increase was mainly due to higher spending for the class of manufacturing ($23.6 billion), followed by the power category ($4.5 billion).

Discover more from Eye On Housing

Subscribe to get the latest posts sent to your email.


This article was originally published by a eyeonhousing.org . Read the Original article here. .

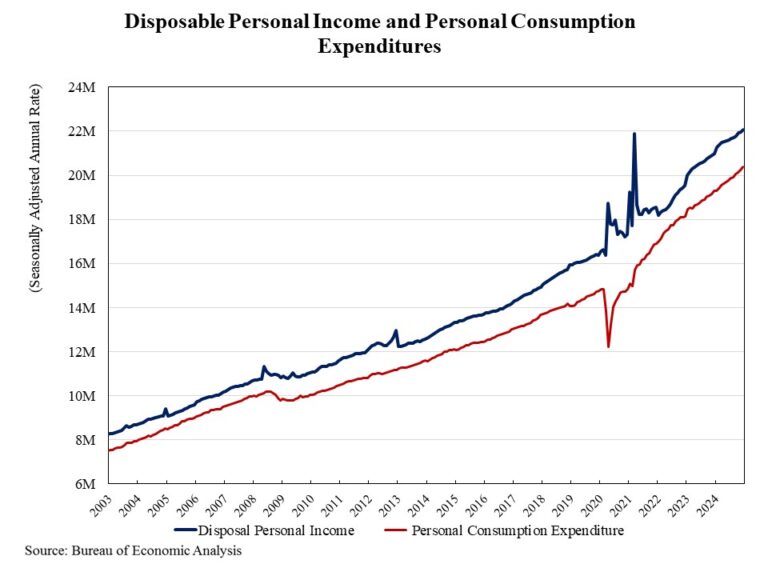
Personal income increased by 0.4% in December, following a 0.3% rise in November and a 0.7% gain in October, according to the latest data from the Bureau of Economic Analysis. The gains in personal income were largely driven by higher wages and salaries. However, the pace of personal income growth slowed from its peak monthly gain of 1.4% in January 2024.

Real disposable income, the amount remaining after adjusted for taxes and inflation, inched up 0.1% in December, matching November’s gain and following a 0.4% increase in October. On a year-over-year basis, real (inflation-adjusted) disposable income rose 2.4%, down from a 6.5% year-over-year peak recorded in June 2023.

Meanwhile, personal consumption expenditures rose 0.7% in December, building on a 0.6% increase in November and 0.5% in October. Real spending, adjusted to remove inflation, increased 0.4% in December, with expenditures on goods climbing 0.7% and spending on services up 0.3%.

As spending outpaced personal income growth, the personal savings rate dipped to 3.8% in December, down from 4.1% in November and 4.3% in October. With inflation eroding compensation gains, people are dipping into savings to support spending. This trend will ultimately lead to a slowing of consumer spending.

Discover more from Eye On Housing

Subscribe to get the latest posts sent to your email.


This article was originally published by a eyeonhousing.org . Read the Original article here. .

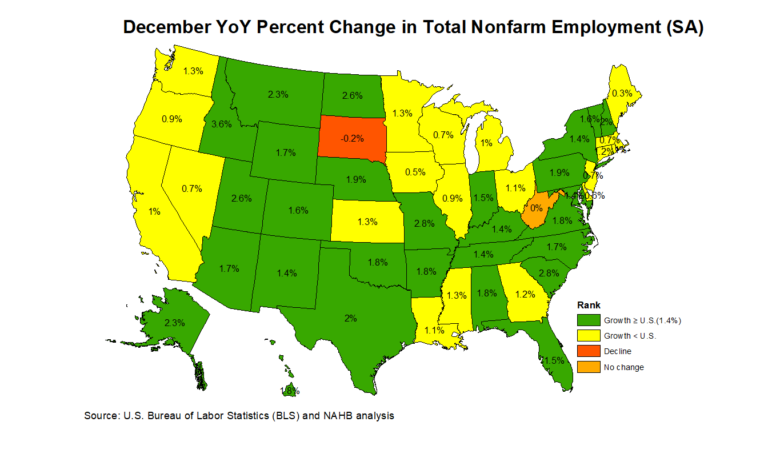
Nonfarm payroll employment increased in 42 states and the District of Columbia in December compared to the previous month, while it decreased in seven states. Wyoming reported no change during this time. According to the Bureau of Labor Statistics, nationwide total nonfarm payroll employment increased by 256,000 in December, following a gain of 212,000 jobs in November.

On a month-over-month basis, employment data was most favorable in Texas, which added 37,500 jobs. Florida came in second (+18,000), followed by California (+15,000). A total of 8,000 jobs were lost across seven states, with Oregon reporting the steepest job losses at 3,700. In percentage terms, employment increased the highest in Missouri at 0.4%, while Vermont saw the biggest decline at 0.2% between November and December.

Year-over-year ending in December, 2.2 million jobs have been added to the labor market across 48 states and the District of Columbia. This is a 1.4% increase compared to the December 2023 level. West Virginia reported no change, while South Dakota lost 1,000 jobs. The range of job gains spanned from 2,000 jobs in Maine to 284,200 jobs in Texas. In percentage terms, the range of job growth spanned 3.6% in Idaho to 0.3% in Maine. South Dakota declined by 0.2%.

Across the nation, construction sector jobs data —which includes both residential and non-residential construction—showed that 26 states reported an increase in December compared to November, while 20 states lost construction sector jobs. The four remaining states and the District of Columbia reported no change on a month-over-month basis. Washington, with the highest increase, added 4,000 construction jobs, while New York, on the other end of the spectrum, lost 4,400 jobs. Overall, the construction industry added a net 8,000 jobs in December compared to the previous month. In percentage terms, South Dakota reported the highest increase at 1.9% and Mississippi reported the largest decline at 2.2%.

Year-over-year, construction sector jobs in the U.S. increased by 196,000, which is a 2.4% increase compared to the December 2023 level. Texas added 31,500 jobs, which was the largest gain of any state, while California lost 12,400 construction sector jobs. In percentage terms, Alaska had the highest annual growth rate in the construction sector at 18.9%. Over this period, West Virginia reported the largest decline of 3.4%.

Discover more from Eye On Housing

Subscribe to get the latest posts sent to your email.


This article was originally published by a eyeonhousing.org . Read the Original article here. .

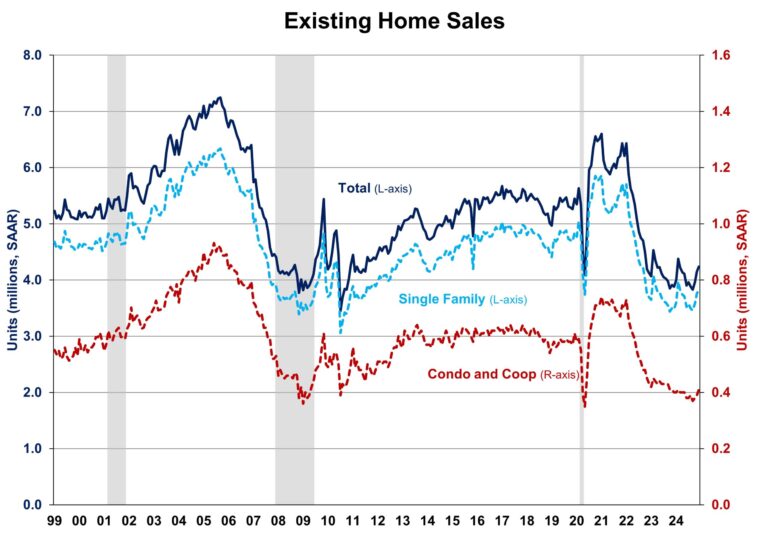
Despite higher mortgage rates and elevated home prices, existing home sales jumped to a 10-month high in December, marking three monthly gains in annual growth, according to the National Association of Realtors (NAR). However, existing home sales end 2024 at 4.06 million, the lowest level since 1995 as the median price reached a record high of $407,500 in 2024. 

While inventory improves and the Fed continues lowering rates, the market faces headwinds as mortgage rates are expected to stay above 6% for longer due to an anticipated slower easing pace in 2025. The prolonged rates may continue to discourage homeowners from trading existing mortgages for new ones with higher rates, keeping supply tight and prices elevated. As such, sales are likely to remain limited in the coming months due to elevated mortgage rates and home prices.

Total existing home sales, including single-family homes, townhomes, condominiums, and co-ops, rose 2.2% to a seasonally adjusted annual rate of 4.24 million in December, the highest level since February 2024. On a year-over-year basis, sales were 9.3% higher than a year ago, the largest annual gain since June 2021. However, total sales in 2024 fell to 4.06 million, breaking below 2023’s record low of 4.10 million and marking the lowest annual level since 1995.

The first-time buyer share rose to 31% in December, up from 30% in November and 29% in December 2023.

The existing home inventory level fell from 1.33 million in November to 1.15 million units in December but is up 16.2% from a year ago. At the current sales rate, December unsold inventory sits at a 3.3-months’ supply, down from 3.8-months last month but up from 3.1-months a year ago. This inventory level remains low compared to balanced market conditions (4.5 to 6 months’ supply) and illustrates the long-run need for more home construction.

Homes stayed on the market for an average of 35 days in December, up from 32 days in November and 29 days in December 2023.

The December all-cash sales share was 28% of transactions, up from 25% in November 2024 but down from 29% in December 2023. All-cash buyers are less affected by changes in interest rates.

The December median sales price of all existing homes was $404,400, up 6.0% from last year. This marked the 18th consecutive month of year-over-year increases. The median condominium/co-op price in December was up 4.5% from a year ago at $359,000. This rate of price growth will slow as inventory increases.

Geographically, three of the four regions saw an increase in existing home sales in December, ranging from 2.6% in the West to 3.9% in the Northeast. Sales in the Midwest fell 1%. On a year-over-year basis, sales grew in all four regions, ranging from 6.5% in the Midwest to 12.9% in the West.

The Pending Home Sales Index (PHSI) is a forward-looking indicator based on signed contracts. The PHSI rose from 77.3 to 79.0 in November due to improved inventory. This marks the highest level since February 2023. On a year-over-year basis, pending sales were 6.9% higher than a year ago per National Association of Realtors data.

Discover more from Eye On Housing

Subscribe to get the latest posts sent to your email.


This article was originally published by a eyeonhousing.org . Read the Original article here. .

The U.S. labor market finished 2024 with solid job growth and a decrease in the unemployment rate.

In December, wage growth slowed. Wages grew at a 3.9% year-over-year (YOY) growth rate, down 0.3 percentage points from a year ago. Wage growth is outpacing inflation, which typically occurs as productivity increases.

National Employment

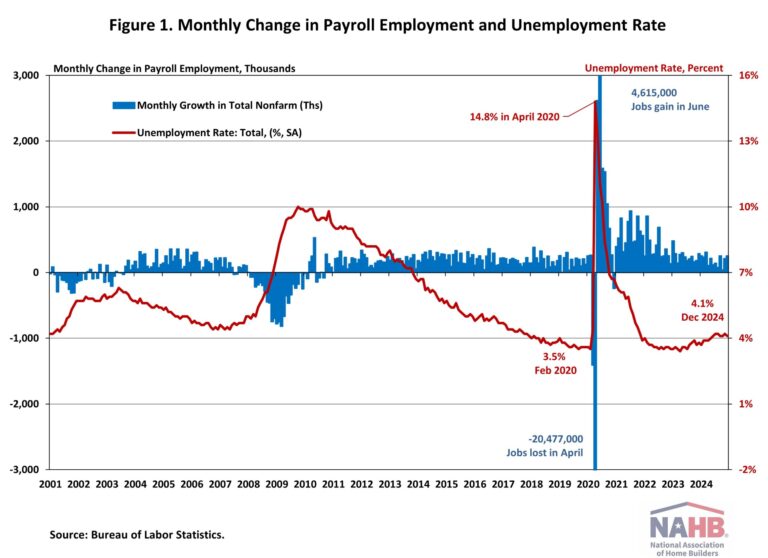
According to the Employment Situation Summary reported by the Bureau of Labor Statistics (BLS), total nonfarm payroll employment rose by 256,000 in December. Since January 2021, the U.S. job market has added jobs for 48 consecutive months, making it the third-longest period of employment expansion on record.

The estimates for the previous two months were revised. The monthly change in total nonfarm payroll employment for October was revised up by 7,000, from +36,000 to +43,000, while the change for November was revised down by 15,000 from +227,000 to +212,000. Combined, the revisions were 8,000 lower than previously reported.

In 2024, more than 2.3 million jobs were created. Additionally, monthly employment growth averaged 186,000 per month, compared to the 251,000 monthly average gain for 2023. The U.S. economy has created nearly 8.7 million jobs since March 2022, when the Fed enacted the first interest rate hike of this cycle.

The unemployment rate decreased to 4.1% in December. While the number of employed persons increased by 478,000, the number of unemployed persons decreased by 235,000.

Meanwhile, the labor force participation rate—the proportion of the population either looking for a job or already holding a job—remained unchanged at 62.5%. For people aged between 25 and 54, the participation rate decreased one percentage point to 83.4%. While the overall labor force participation rate remains below its pre-pandemic levels of 63.3% at the beginning of 2020, the rate for people aged between 25 and 54 exceeds the pre-pandemic level of 83.1%.

In December, employment continued to trend up in health care (+46,000), government (+33,000), and social assistance (+23,000). Retail trade added 43,000 jobs, following a job loss in November.

Construction Employment

Employment in the overall construction sector increased by 8,000 in December, after 8,000 gains in November. While residential construction gained 4,000 jobs, non-residential construction employment added 4,700 jobs for the month.

Residential construction employment now stands at 3.4 million in December, broken down as 961,000 builders and 2.4 million residential specialty trade contractors. The 6-month moving average of job gains for residential construction was 3,333 a month. Over the last 12 months, home builders and remodelers added 51,000 jobs on a net basis. Since the low point following the Great Recession, residential construction has gained 1,396,200 positions.

In December, the unemployment rate for construction workers rose to 5.5% on a seasonally adjusted basis. The unemployment rate for construction workers has remained at a relatively lower level, after reaching 15.3% in April 2020 due to the housing demand impact of the COVID-19 pandemic.

Discover more from Eye On Housing

Subscribe to get the latest posts sent to your email.


This article was originally published by a eyeonhousing.org . Read the Original article here. .

The Market Composite Index, a measure of mortgage loan application volume from the Mortgage Bankers Association’s (MBA) weekly survey, increase marginally by 2.9% month-over-month on a seasonally adjusted (SA) basis. Compared to December 2023, the index is higher by 10.2%. The Market Composite Index includes the Purchase and Refinance Indices, which saw monthly gains of 4.1% and 6.7% (SA), respectively. On a year-over-year basis, the Purchase Index showed a modest increase of 1.1%, while the Refinance Index is 31.7% higher.

The average 30-year fixed rate mortgage reported in the MBA survey for December remained relatively stable at 6.82% (index level 682), reflecting a minor decline of 0.4 basis points. This rate is 9 basis points lower than the same period last year.

Average loan sizes, excluding refinance loans, saw slight declines in December. On a non-seasonally adjusted (NSA) basis, the average loan size (purchases and refinances combined) fell by 2.1% from November to $370,300. For purchase loans, the average size decreased by 3.3% to $421,800, while refinance loans experienced a 4.8% increase, reaching an average of $304,500. Adjustable-rate mortgages (ARMs) also saw a marginal decline in loan size, down 0.8% from $1.08 million to $1.07 million.

Discover more from Eye On Housing

Subscribe to get the latest posts sent to your email.


This article was originally published by a eyeonhousing.org . Read the Original article here. .
Pin It