Tag

data

Browsing


The homeownership rate for those under the age of 35 dropped to 37% in the third quarter of 2024, reaching the lowest level since the first quarter of 2020, according to the Census’s Housing Vacancy Survey (HVS). Amidst elevated mortgage interest rates and tight housing supply, housing affordability is at a multidecade low. The youngest age group, who are particularly sensitive to mortgage rates, home prices, and the inventory of entry-level homes, saw the largest decline among all age categories.

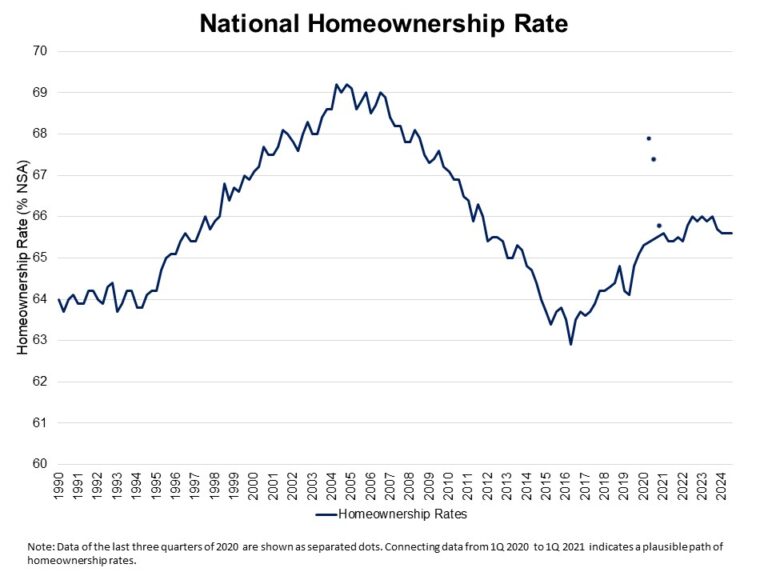
The U.S. homeownership rate held steady at 65.6% in the third quarter of 2024, showing a flat trend over the last three quarters.  However, this marks the lowest rate in the last two years. The homeownership rate remains below the 25-year average rate of 66.4%.

The national rental vacancy rate went up to 6.9% for the third quarter of 2024, and the homeowner vacancy rate inched up to 1%. The homeowner vacancy rate remains close to the survey’s 67-year low of 0.7%.

Homeownership rates declined across all age groups compared to a year ago, except for those aged 55-64. Householders under 35 experienced the largest drop, declining by 1.3 percentage points from 38.3% to 37%. The 45-54 age group also saw a 1.3 percentage point decrease, decreasing from 71% to 69.7%. For householders aged 35-44, who experienced a modest 0.6 percentage point decline. Among those 65 years and over, homeownership inched down slightly from 79.2% to 79.1%. In contrast, the homeownership rate of the 55–64 age group rose to 75.9% from 75.4%.

The housing stock-based HVS revealed that the count of total households increased to 132.1 million in the third quarter of 2024 from 130.3 million a year ago. The gains are largely due to gains in both renter household formation (1.1 million increase), and owner-occupied households (655,000 increase).

Discover more from Eye On Housing

Subscribe to get the latest posts sent to your email.


This article was originally published by a eyeonhousing.org . Read the Original article here. .
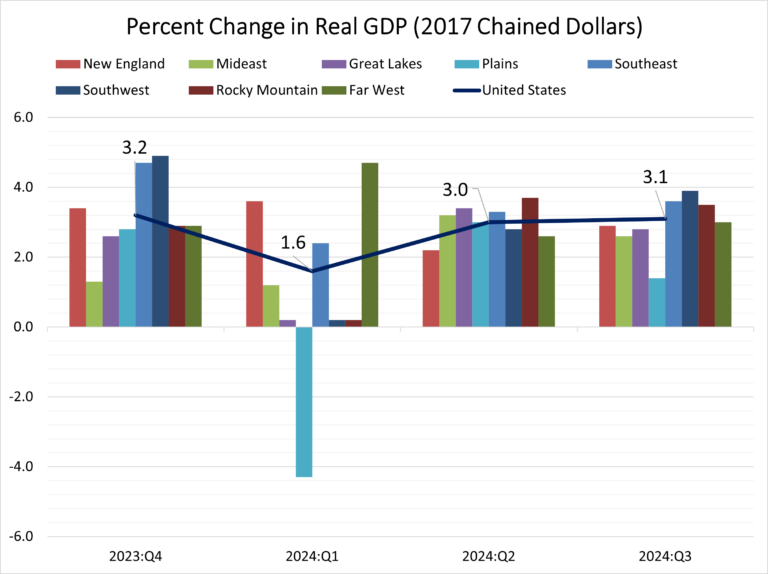

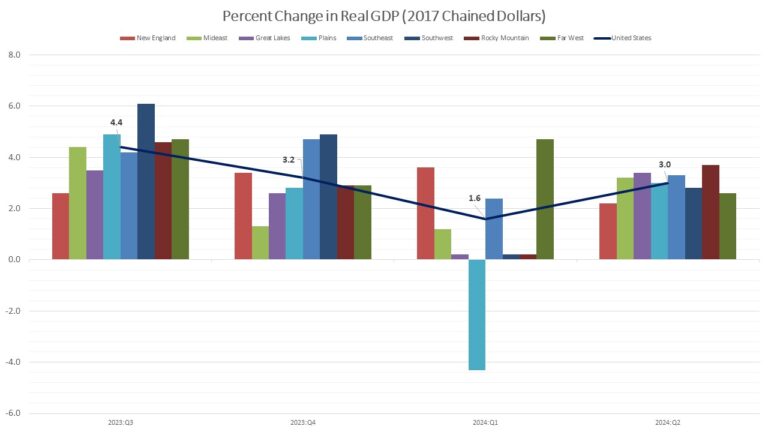
Real gross domestic product (GDP) increased in 49 states and the District of Columbia in the second quarter of 2024 compared to the last quarter of 2023 according to the U.S. Bureau of Economic Analysis (BEA). Alaska reported an economic contraction during this time. The percent change in real GDP ranged from a 5.9 percent increase at an annual rate in Idaho to a 1.1 percent decline in Alaska.

Nationwide, growth in real GDP (measured on a seasonally adjusted annual rate basis) increased 3.0 percent in the second quarter of 2024, which is higher than the first quarter level of 1.6 percent. Nondurable-goods manufacturing; finance and insurance; and health care and social assistance were the leading contributors to the increase in real GDP across the country.

Regionally, real GDP growth increased in all eight regions between the first and the second quarter. The percent change in real GDP ranged from a 3.7 percent increase in the Rocky Mountain region (Colorado, Idaho, Montana, Utah, and Wyoming) to a 2.2 percent increase in the New England region (Connecticut, Maine, Massachusetts, New Hampshire, Rhode Island, and Vermont).

At the state level, Idaho posted the highest GDP growth rate (5.9 percent) followed by Kansas (5.6 percent) and Nebraska (5.3 percent). On the other hand, Alaska posted an economic contraction in the second quarter of 2024. The agriculture, forestry, fishing, and hunting industry was the leading contributor to growth in 11 states including Idaho, Kansas, Nebraska, and the states with the highest increases in real GDP, respectively. Mining, which declined in 33 states, was the leading contributor to the decrease in real GDP in Alaska, the only state with a decline in real GDP.

Discover more from Eye On Housing

Subscribe to get the latest posts sent to your email.


This article was originally published by a eyeonhousing.org . Read the Original article here. .

In the latest 2023 NAHB member census, 21% of NAHB builder members listed residential remodeling as their primary business. These remodelers tend to be relatively small, with a median of five employees and a median annual revenue of $1.8 million.  They are thus even smaller than NAHB builder members in general, who had a median of six employees and median annual revenue of $3.4 million, as reported in a recent post.

Among the residential remodelers, 21% reported a dollar volume of less than $500,000 in 2023, 20% reported between $500,000 and $999,999, 47% between $1.0 and $4.9 million, 8% between $5.0 and $9.9 million, 2% between $10.0 million and $14.9 million, and another 2% reported $15.0 million or more. None reported zero business activity in 2023.

The median annual revenue for residential remodelers in 2023 was $1.8 million—considerably below the $3.4 million median calculated across all NAHB builder members, and a small fraction of the $45.0 million threshold the Small Business Administration uses to classify construction businesses as small. Even so, residential remodelers’ median revenue was up from the $1.2 million recorded in 2022.

The median number of payroll employees was also relatively small among NAHB’s residential remodelers in 2023—five, compared to six for all NAHB builder members. Both numbers were unchanged from 2022.

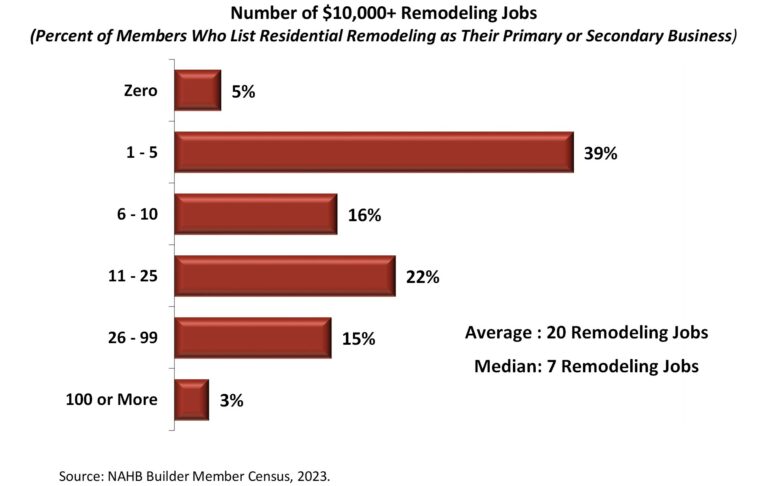
To provide a measure of housing activity roughly analogous to starts, the NAHB census asked builder members who are primarily or secondarily residential remodelers about the number of remodeling jobs they completed in 2023 costing $10,000 or more. The responses show that a plurality of 39% completed 1 to 5 jobs of this size, 16% did 6 to 10, 22% did 11 to 25, 15% did 26 to 99, and 3% completed 100 or more jobs costing more than $10,000. On average, builder members involved in residential remodeling as a primary or secondary activity completed 20 jobs costing $10,000 or more in 2023. The median number was 7.

The numbers are significantly higher if the calculations are confined to the 21% of NAHB builder members who list residential remodeling specifically as their primary activity. These members completed an average of 32 and a median of 15 $10,000-plus jobs in 2023. These results are not significantly different from the ones reported in 2022, when NAHB first included the remodeling jobs question in its member census.

Discover more from Eye On Housing

Subscribe to get the latest posts sent to your email.


This article was originally published by a eyeonhousing.org . Read the Original article here. .

If you’re a homeowner waiting on the sidelines for the perfect time to sell your home, this week could be your time to shine.

Despite mortgage rates inching closer to 7%, a recent research from Realtor.com indicated the week of April 14-20 might be the ideal week for potential sellers to list, as spring historically brings with it higher buyer demand and a market with low inventory, setting the stage for bigger bids.

Some homeowners have been on the sidelines for two years, waiting for mortgage rates to fall, additional survey data from the site showed.

However, while 50% say they’re willing to hold out longer in hopes of rate drops, nearly 30% say they need to sell soon for “personal reasons,” including profits, need for more space, or plans to rent, to name a few.

SELLING YOUR HOUSE? HERE’S THE BEST TIME TO DO IT

The best time to sell your home might be the week of April 14-20, according to Realtor.com data. (REUTERS/Jeff Haynes  / Reuters Photos)

Survey data also showed that sellers are adjusting their expectations to meet the current market, with 8 in 10 settling in on the expectation that the mortgage for a newer home will be higher than their current home. 

“With the market cooling in many areas, 12% expect a bidding war to take place (vs 27% in 2023), and only 15% expect to get more than their asking price (vs 31% last year),” the report continued.

The separate analysis from last month pointed to the April 14-20 listing timeframe by taking into account the number of buyers, listing prices and seasonal trends, to determine the period for the most favorable for home selling conditions.

TIME TO SELL YOUR HOME? HERE ARE 3 QUESTIONS TO ASK YOURSELF

50% of sellers still on the sidelines say they will wait out rates while 29% say they need to sell soon. (FOX Business / Getty Images)

“We’ve got the most favorable balance of all of these factors for sellers. It suggests they will be able to sell quickly at a good price and be happy with the outcome,” said Realtor.com chief economist Danielle Hale.

The report indicated that this week offers a higher-than-average number of buyers along with a lower-than-average time on the market and higher-than-average prices, coming in at 1.1% higher than the average for other weeks throughout the year.

REALTOR DESCRIBES THE SHIFT THAT’S DRIVING REAL ESTATE ‘ACROSS THE BOARD’ IN TOP MARKETS

Realtor.com analysis indicates that homes historically reached higher prices during the week of April 14. (Photo by STEFANI REYNOLDS/AFP via Getty Images / Getty Images)

FOX Business’ Gerri Willis, speaking on “Varney & Co.,” on Monday said “sellers are getting more realistic,” noting that they have to “embrace” current rates.

Rates for 30-year mortgages averaged 6.88% last week, according to Freddie Mac’s latest survey. 

GET FOX BUSINESS ON THE GO BY CLICKING HERE


This article was originally published by a www.foxbusiness.com . Read the Original article here. .
Pin It