Tag

Credit

Browsing


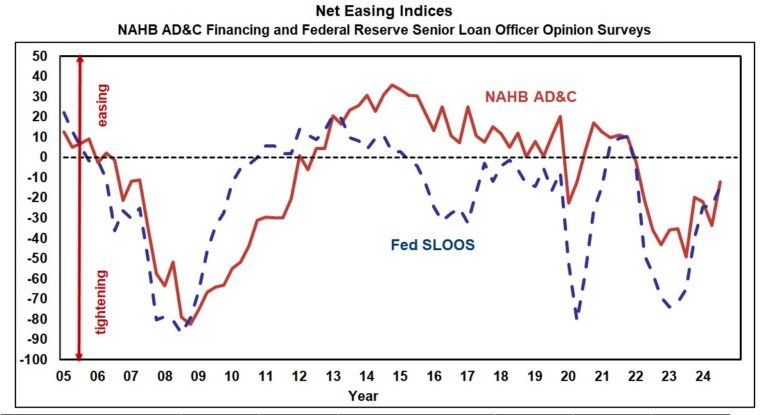
In the third quarter of 2024, borrowers and lenders agreed, as they have over most of the past three years, that credit for residential Land Acquisition, Development & Construction (AD&C) tightened. On the borrower’s side, the net easing index from NAHB’s survey on AD&C Financing posted a reading of -12.0 (the negative number indicates credit was tighter than in the previous quarter). On the lender’s side, the comparable net easing index based on the Federal Reserve’s survey of senior loan officers posted a similar reading of -14.8.  Although the additional net tightening was relatively mild in the third quarter (as indicated by negative numbers that were smaller, in absolute terms, than they had been at any time since 2022 Q1), both surveys indicate that credit has tightened for eleven consecutive quarters—so credit for AD&C must now be significantly tighter than it was in 2021.   

According to  NAHB’s survey, the most common ways in which lenders tightened in the third quarter were by lowering the loan-to-value (or loan-to-cost) ratio, and requiring personal guarantees or collateral not related to the project—each reported by 61% of builders and developers. After those two, reducing the amount lenders are willing to lend was in the third place, with 56%.

Additional information from the Fed’s survey of lenders—including measures of demand and net easing for residential mortgages—is discussed in an earlier post.

Although the availability of credit for residential AD&C was tighter in the third quarter, builders and developers finally got some relief from the elevated cost of credit that has prevailed recently. In the third quarter, the contract interest rate decreased on all four categories of AD&C loans tracked in the NAHB survey. The average rate declined from 9.28% in 2024 Q2 to 8.50% on loans for land acquisition, from 9.05% to 8.83% on loans for land development, from 8.98% to 8.54% on loans for speculative single-family construction, and from 8.55% to 8.11% on loans for pre-sold single-family construction.

More detail on credit conditions for builders and developers is available on NAHB’s AD&C Financing Survey web page.

Discover more from Eye On Housing

Subscribe to get the latest posts sent to your email.


This article was originally published by a eyeonhousing.org . Read the Original article here. .

Nearly 1.3 million tax returns filed for tax year 2023 utilized the Residential Clean Energy Credit (25D tax credit), according to the latest IRS clean energy tax credit statistics. Through May 23rd of the 2024 tax filing season for 2023 returns, almost 138 million tax returns had been filed with the IRS, which indicates that 0.9% of returns filed utilized the 25D credit. Both 25C (Energy Efficient Home Improvement Credit) and 25D are claimed on Form 5695, as both are residential energy tax credits. A previous blog discussed the 25C credit, while this one focuses on the 25D credit. The two credits main difference is that 25C relates to improvements that make homes more energy efficient, while 25D is focused on investments associated with renewable energy in the home. The 25D credit is an annual credit that taxpayers may claim for investing in renewable energy for their residence, such as solar, wind, geothermal, fuel cells or battery storage technology.

The 25D tax credit allows home owners to claim qualifying residential clean energy expenditures made to their primary or secondary residence. Renters can also claim the credit for certain residential clean energy expenditures made to their residence while landlords cannot. Additionally, 25D can be applied to newly constructed homes as well as existing homes. The 25D credit amount is based on 30% of the clean energy expenditure and, unlike 25C, has no credit limit with one exception— the credit for fuel cell property expenditures is 30% up to $500 for each half kilowatt of capacity for the qualified fuel cell property. The 30% credit amount will fall to 26% in 2033 and 22% in 2034. Taxpayers can also include installation costs in the calculation of their credit amount.  While the credit is non-refundable, taxpayers can carryforward the credit to reduce their tax liability in future years. Clean energy property must meet certain standards to qualify for the credit. For example, geothermal heat pumps must meet Energy Star requirements at the time of purchase.

Cost of Energy Property and Usage

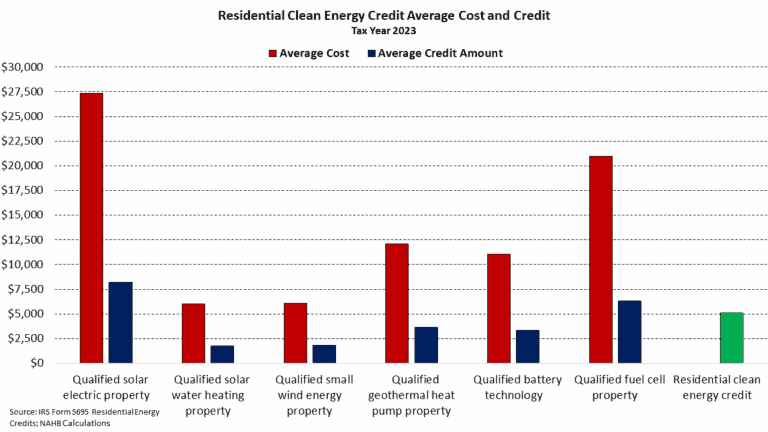
The recent IRS data indicates that the most expensive clean energy investment claimed in tax year 2023 was the purchase and installation of qualified solar electric property at an average cost of $27,355. Shown below are the average cost and average credit (30% of cost) across each investment, while the average credit amount across all returns that claimed 25D is shown in green at $5,084. While not shown below, the average credit claimed in 2023 that was carryforward from a previous year was $7,019 and the average credit carryforward to next year was $7,464. Both carryforward credits were higher than the average credit amount claimed in 2023.

Solar electric property was also by far the most frequently claimed investment at 752,300 returns. The next highest claimed investment was qualified solar water heating property, with 139,130 returns. No other improvement appeared on over 100,000 returns. The qualified improvement that was least claimed on tax returns was fuel cell property, with only 35,850 returns. Fuel cell property is the only expenditure subject to a cap.

Income and Geographic Differences

The Residential Clean Energy Credit is not subject to income limitations, meaning any taxpayer regardless of income can claim the credit on their tax return. The income level that most frequently claimed the credit was between $500,000 and $1,000,000 at 1.99%. Given the average cost of each improvement, it comes as little surprise that lower incomes claim the credit less frequently.

Geographically, the highest claim rate of the 25D tax credit was in Nevada, with 2.0% of returns claiming the credit. Florida had the second highest claim rate at 1.8%. The lowest claim rate was in North Dakota, at just 0.2%. Of note, higher usage rates of the 25D tax credit are found in states in the southwest, with Nevada (2.0%), Arizona (1.6%), Texas (1.6%), California (1.6%), and New Mexico (1.5%) all ranking in the top ten. This may be due to their significantly higher exposure to the sun, leading to higher potential benefits from installing solar electric property.

New Hampshire had the highest average credit amount at $7,581. This was $500 more than the second highest state which was Hawaii at $7,055. The lowest average credit amount was in Mississippi, at $2,248.

Discover more from Eye On Housing

Subscribe to get the latest posts sent to your email.


This article was originally published by a eyeonhousing.org . Read the Original article here. .

Approximately 2.3 million tax returns filed for tax year 2023 utilized the Energy Efficient Home Improvement credit (25C tax credit), according to the latest IRS clean energy tax credit statistics. Through May 23rd of the 2024 tax filing season for 2023 returns, almost 138 million tax returns had been filed with the IRS, which indicates that 1.7% of returns filed utilized the 25C credit. There are various types of improvements that can be claimed under the 25C credit; each improvement varies in its cost and credit amount. Additionally, claim rates of the 25C tax credit varies across taxpayers’ incomes as well as geographies. This post examines these data.

The 25C tax credit allows homeowners to claim qualifying energy efficiency improvements to their primary or secondary residence. Renters can also claim the credit for certain energy efficient appliance and product expenditures. The 25C credit amount is based on 30% of the improvement’s cost and is subject to the improvement’s specific credit limit. For improvements such as electric or natural gas heat pumps, heat pump water heaters, or biomass stoves/boilers, the credit limit per year is $2,000. All other home improvements, such as efficient AC units, insulation/air sealing or home energy audits are limited to a combined credit limit of $1,200, with individual limitations for each item. The total annual credit amount that can be claimed is $3,200 per year. The table below from the Department of Energy shows the available tax credit amounts for tax years 2023 through 2032.

Cost of Improvement and Usage

The credit can cover both the purchase and installation costs for heat pumps, energy efficient AC units, furnaces/ boilers, water heaters, biomass stoves/ boilers, and electric panel/circuit board upgrades. For building envelope components (insulation, doors, windows, skylights), only the purchase can be covered.

The recent IRS data indicates that the most expensive improvement claimed in tax year 2023 was the purchase and installation of electric or natural gas heat pumps at an average cost of $11,213. The costliest item that did not cover installation costs was exterior windows and skylights at $9,143.

Shown below in orange are the average costs for each 25C improvement item in the IRS data. In blue is the credit amount of each improvement, based on its average cost and applicable credit limits. For almost all items, 30% of the improvement’s cost far surpass the credit limit amounts. The only exceptions are heat pump water heaters and biomass stoves/broilers that on average do not exceed the credit limit.

For example, the average cost of installation and purchase of a biomass stove/broiler was $5,221. Taking 30% of this cost, we find a credit amount of $1,566, which is below the credit limit of $2,000 for this improvement. Compared with the costliest improvement, electric or natural gas heat pumps, 30% of the average cost is $3,364. This is above the credit limit, making the largest possible credit amount $2,000 for electric or natural gas heat pumps installation and purchase. The average credit amount, shown below in purple, was $882, well below the maximum possible credit limit of $3,200, shown in light purple.

Of the 2.3 million taxpayers that claimed the 25C credit, the most frequent improvement was the purchase of insulation or air sealing materials or system with 699,440 returns (29.9%). This improvement is the only item to the combined cap of $1,200 that also has an individual limit of $1,200. Improvements that have a combined limit of $1,200 are in the green shaded box below. The least claimed improvement was home energy audits, which also had the lowest credit limit of $150.

Income and Geographic Differences

The highest claim rate of the 25C credit by income was for taxpayers in the $200,000-$500,000 income range, with 4.83% of returns claiming a 25C tax credit. The lowest was for incomes between $1-$10,000, as 0.02% of returns claimed the credit.

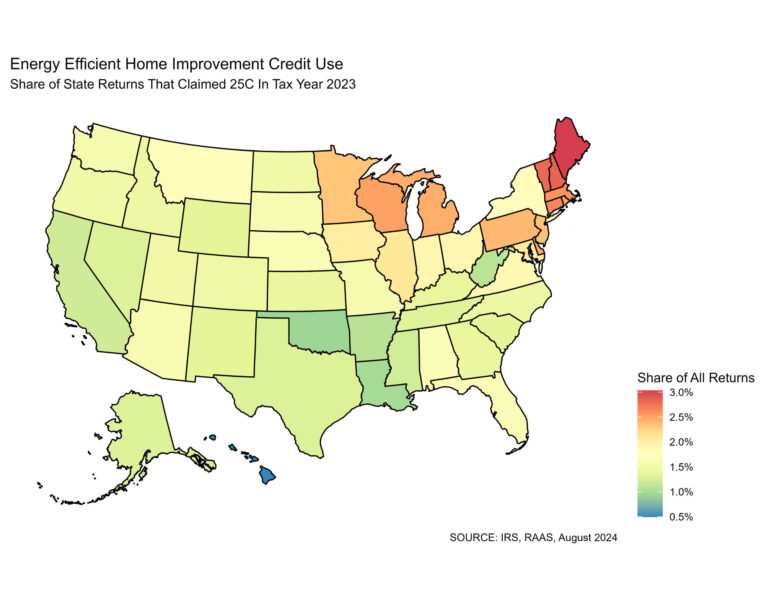
Geographically, the highest claim rate of the 25C tax credit was in Maine, with 3.03% of tax returns in the state claiming 25C. The lowest rate was in Hawaii, where only 0.50% of returns claimed the credit. Usage was significantly higher in the Midwest and Northeast, as the top 10 usage rates were all located in these regions.

While Maine has the highest claim rate, Washington had the highest average credit amount at $1,191. The lowest average credit amount was in Iowa, at $743. Of particular note, Michigan and Wisconsin had low average credit amounts but were among the top ten in terms of claim rates. In Michigan, the average credit amount was $747, ranking 49th (includes DC), while the claim rate was 9th at 2.45%. In Wisconsin, the average credit amount was $761, ranking 48th, and the claim rate was 6th, at 2.51%. The reasoning for this trend could be due to the type of improvements by region but there is no IRS data published yet to clarify this hypothesis.

Additionally, usage rates could be relatively lower in the Southern portion of the U.S. because the costliest items, such as heat pumps, are not as critical as regional weather is warmer. Since this credit cannot be applied to new construction, it should also be noted that most new homes are being built with central AC, making it less likely to be claimed as a 25C improvement. Also, most homes in the North are built without heat pumps which allows for more opportunity for the cost to be claimed under 25C if such improvement is made. Nationally, the claim rate was 1.7% with an average credit amount of $882.

Discover more from Eye On Housing

Subscribe to get the latest posts sent to your email.


This article was originally published by a eyeonhousing.org . Read the Original article here. .

Total outstanding US consumer debt stood at $5.08 trillion for the first quarter of 2024, increasing at an annualized rate of 2.46% (seasonally adjusted), according to the Federal Reserve’s G.19 Consumer Credit Report. From the second quarter of 2023 to the second quarter of 2024, the total increased by 1.84%. This year-over-year (YoY) growth rate is the lowest observed since the first quarter of 2021.

Nonrevolving and Revolving Debt

Of the total outstanding US debt in the first quarter of 2024, the nonrevolving share is 74%, with revolving at 26%. Nonrevolving debt (primarily student and auto loans) stands at $3.73 trillion (SA) for the second quarter of 2024. Revolving debt (mainly credit card debt) stands at $1.34 trillion.

The pace of growth has slowed for both nonrevolving and revolving debt as households’ pandemic-era savings have dwindled. In terms of YoY growth, both nonrevolving and revolving debt peaked in the fourth quarter of 2022 at 15.10% and 5.34% respectively. In the second quarter of 2024, the YoY growth rate for nonrevolving debt decreased to 6.12%, from 7.99% in the first quarter, while the growth rate for revolving debt increased from 0.14% to 0.39%. This was the sixth consecutive quarterly decline in YoY growth for nonrevolving debt while revolving debt saw its first uptick in the YoY rate in five quarters.

Student and Auto Loans

Breaking down the components of nonrevolving debt, student loans account for 47%, and auto loans make up 42% (the G.19 report excludes real estate loans). Collectively, the other loans make up the remaining 11% of nonrevolving debt.

Student loans in the second quarter of 2024 totaled $1.74 trillion (non-seasonally adjusted), marking the fourth consecutive decrease in the YoY rate at -0.96%, following an annual decrease of -1.22% in the previous quarter. The third quarter of 2023 marked the first YoY decrease for student loan debt since the data was first reported.

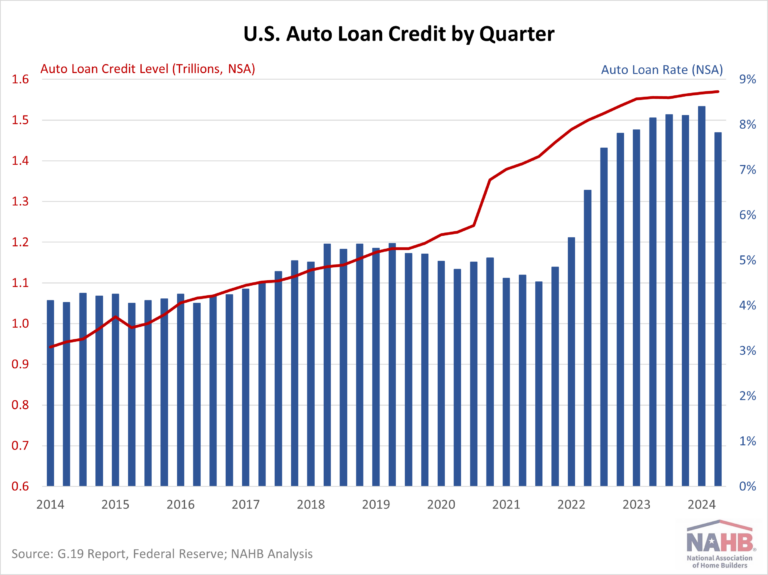
Auto loan debt for the second quarter of 2024 was $1.57 trillion (NSA). Auto loan YoY growth has steadily decelerated over the past six quarters. The fourth quarter of 2021 saw a high of 13.74% YoY growth compared to the second quarter of 2024 YoY growth rate of 1.95%. This slowdown partially reflects the relatively high interest rate on auto loans, which have increased from 4.52% in Q1 2022 to 8.20% in Q2 2024 (60-month new car loans). However, this car loan rate experienced its first (albeit slight) decline in over two years, falling from 8.22% in the previous quarter.

Credit Cards

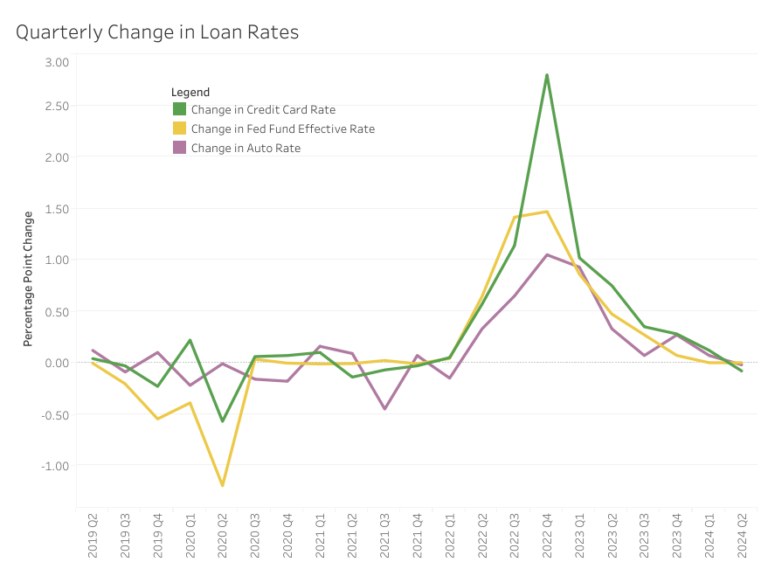
The interest rate on credit cards saw its first decrease since the fourth quarter of 2021.  The interest rate for the second quarter of 2024 was 21.51%, falling from 21.59% in the previous quarter. Before this quarter, the rate experienced nine consecutive quarterly increases, with a dramatic increase of 2.8 percentage points from Q3 2022 to Q4 2022. This aligns closely with the Federal Funds Effective Rate increasing 1.47 percentage points during the same period, the highest increase since the 1980s.

Discover more from Eye On Housing

Subscribe to get the latest posts sent to your email.


This article was originally published by a eyeonhousing.org . Read the Original article here. .

During the second quarter of 2024, credit for residential Land Acquisition, Development & Construction (AD&C) continued to tighten and became even more expensive for most types of loans, according to NAHB’s survey on AD&C Financing. The survey was conducted in July and asked specifically about financing conditions in the second quarter, predating the release of some relatively weak economic data that has raised prospects for monetary policy easing.

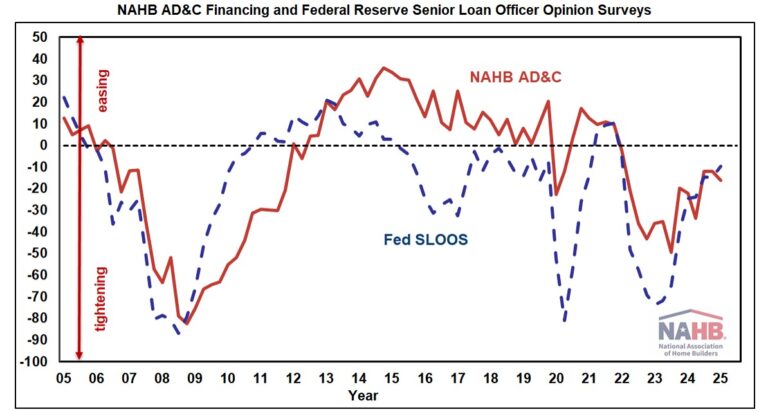
The net easing index derived from the survey posted a reading of -33.7 in the second quarter (the negative number indicating that credit was tighter than in the previous quarter). The comparable net easing index based on the Federal Reserve’s survey of senior loan officers posted a similar result, with a reading of -23.8—marking the tenth consecutive quarter of borrowers and lenders both reporting tightening credit conditions.

According to the NAHB survey, the most common ways in which lenders tightened in the second quarter were by reducing the amount they are willing to lend, and by lowering the loan-to-value (or loan-to-cost) ratio, each reported by 85% of builders and developers. After those two ways of tightening, three others tied for third place: increasing documentation, increasing the interest rate, and requiring personal guarantees or other collateral unrelated to the project, each reported by exactly half of the borrowers.

As is often the case, as credit becomes less available it also tends to become more expensive. In the second quarter, the contract interest rate increased on all four categories of AD&C loans tracked in the NAHB survey: from 8.40% in 2024 Q1 to 9.28% on loans for land acquisition, from 8.07% to 9.05% on loans for land development, from 8.24% to 8.98% on loans for speculative single-family construction, and from 8.38% to 8.55% on loans for pre-sold single-family construction.

In addition to the contract rate, initial points charged on the loans can be an important component of the overall cost of credit, especially for loans paid off as quickly as typical single-family construction loans. Trends on average initial points were mixed in the second quarter. The average charge on loans for land acquisition was unchanged at 0.88%. The average declined from 0.85% to 0.70% on loans for land development, and from 0.57% to 0.47% on loans for pre-sold single-family construction. On the other hand, on loans for speculative single-family construction, average initial points increased from 0.76% to 0.89%.

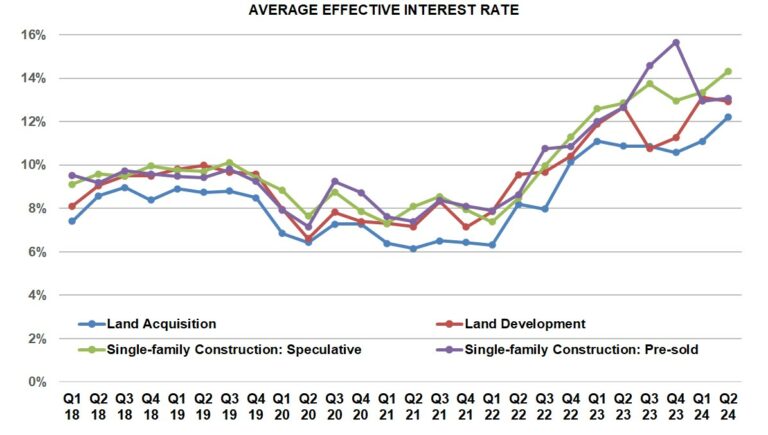
Irrespective of changes in points, increases in the underlying contract rate were sufficient to drive up the average effective interest rate (calculated taking both contract rate and initial points into account), on three of the four categories of AD&C loans in the second quarter. The average effective rate increased from 11.09% to 12.22% on loans for land acquisition, from 13.35% to 14.32% on loans for speculative single-family construction, and from 12.95% to 13.08% on loans for pre-sold single-family construction. Meanwhile, the average effective rate declined on loans for land development—from 13.10% in 2024 Q1 to 12.93%.

The average effective rates on loans for land acquisition and speculative single-family construction in the second quarter of 2024 were the highest they’ve been since NAHB began collecting the information in 2018. However, there’s a reasonable chance the situation will improve in the third and fourth quarters, as the Federal Reserve has begun signaling its intent to cut rates later this year.

More detail on credit conditions for builders and developers is available on NAHB’s AD&C Financing Survey web page.

Discover more from Eye On Housing

Subscribe to get the latest posts sent to your email.


This article was originally published by a eyeonhousing.org . Read the Original article here. .
Pin It