Tag

Continues

Browsing


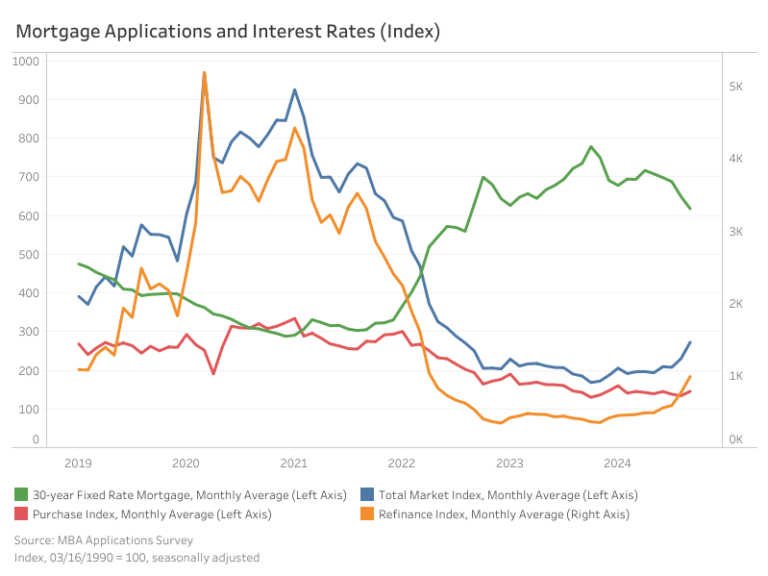
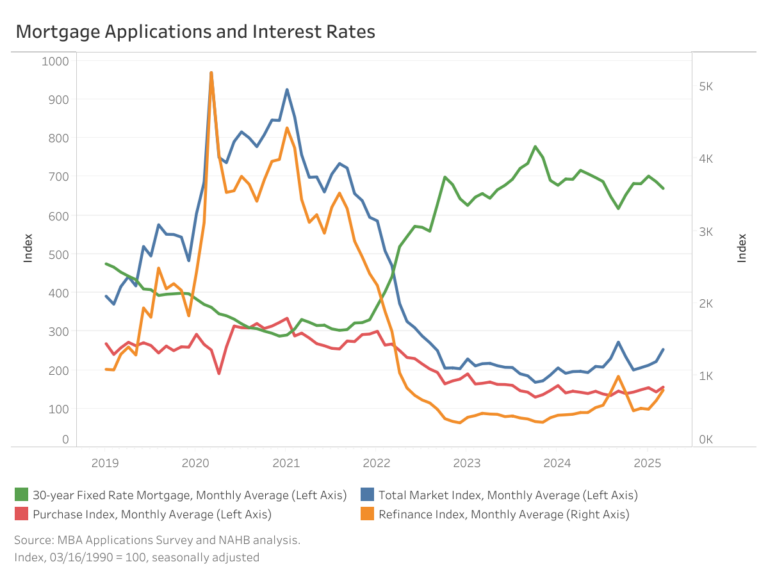
The Market Composite Index, a measure of mortgage loan application volume by the Mortgage Bankers Association’s (MBA) weekly survey, rose 18.4% month-over-month on a seasonally adjusted (SA) basis, driven primarily by a surge in refinancing activity. Compared to September 2023, the index increased by 47%. The Market Composite Index which includes the Purchase and Refinance Indices saw monthly gains, rising by 8.6% and 29%, respectively. Year-over-year, the Purchase Index showed a modest increase of 1.9%, while the Refinance Index jumped 149.9%.

The average 30-year fixed mortgage rate continued its downward trajectory for the fifth consecutive month, with September seeing a decline of 31 basis points (bps), bringing the rate to 6.18%. This is 117 bps lower than the same time last year.

Loan sizes also saw growth across the board. The average loan size for the total market (including purchases and refinances) was $400,450 on a non-seasonally adjusted (NSA) basis, an increase of 5.1% from August. Purchase loans grew by 3% to an average of $439,600, while refinance loans jumped by 11.6% to $363,825. Adjustable-rate mortgages (ARMs) saw an 8.2% increase in average loan size, rising from $1.1 million to $1.2 million.

Discover more from Eye On Housing

Subscribe to get the latest posts sent to your email.


This article was originally published by a eyeonhousing.org . Read the Original article here. .


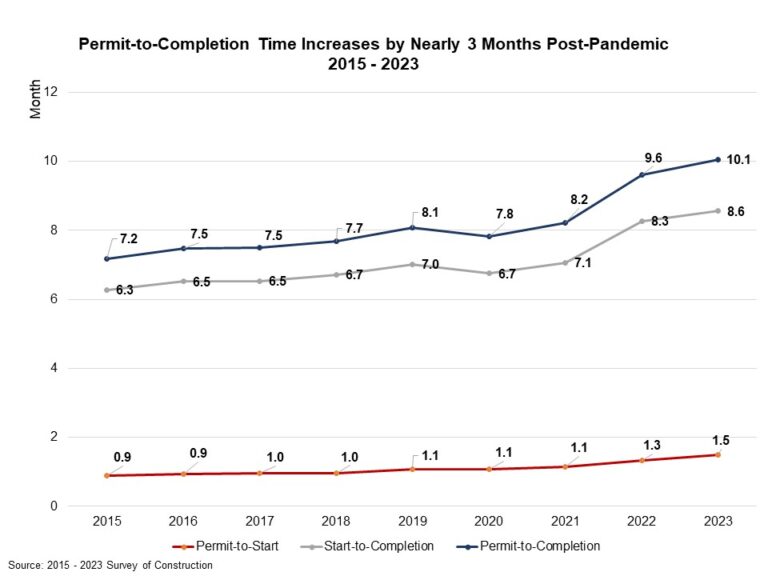
The average completion time of a single-family house in 2023 was approximately 10.1 months, breaking down to 1.5 months for authorization to start construction and another 8.6 months to finish construction. According to the Census Bureau’s Survey of Construction, the permit-to-completion time has been on an upward trend since 2015. Currently, it is almost 3 months longer than the average completion time in 2015. This extended duration is largely attributable to a more stringent regulatory environment, ongoing supply-chain challenges and a shortage of skilled labor.

Among all single-family houses completed in 2023, homes built for sale required the shortest amount of time, 8.9 months from obtaining building permits to completion. Meanwhile, homes built by owners (custom builds) required the longest time, 15.2 months. Homes built by hired contractors tookabout12.1 months, and homes built-for-rent took about 12.2 months from authorization to completion.

The time from permit to start for all types of homes was longer in 2023. The period of time necessary to start construction required, on average, 1.5 months in 2023. In contrast, prior to 2017 construction typically started within the same month after obtaining building authorization. Between authorization and the start of construction, built for sale and built by contractors on owner’s land required 1.5 months and 1.4 months respectively. The permit-to-start time was even longer for homes built-for-rent and custom builds (1.6 months).

The chart below illustrates that permit-to-completion time differs across home sizes. The smallest single-family homes, under 1,200 sq. ft., required 13 months to finish, relatively longer than larger homes under 5,000 sq. ft. This prolonged period is primarily because half of these smaller homes are constructed specifically for rental purposes, which typically takes longer building time from authorization. In contrast, homes ranging from 1,200 to 3,999 sq. ft. are built at the average building time, typically around 10 months. As the size increases beyond 4,000 sq. ft., there is a noticeable upward trend in completion times. Homes with 4,000-4,999 sq. ft. take about 12 months, while those between 5,000- 5,999 sq. ft. extend to a little more than 14 months. Homes over 6,000 sq. ft. take the longest to build, requiring almost 18 months from permit to finish.

The average time from authorization to completion also varies across divisions. The division with the longest duration was New England (13.9 months), followed by the Middle Atlantic (13.2 months), the Mountain division (11.4 months), and the Pacific division (11.2 months) in 2023. These four divisions exceeded the nation’s average of10.1 months. The shortest period, 8.9 months, is registered in the South Atlantic division. The average waiting period from permit to construction start varies from the shortest time of 0.9 months in the East North Central to the longest of 2 months in New England.

The SOC also collects additional information for houses built for sale, including a sale date when buyers sign sale contracts or make a deposit. Looking at single-family homes built for sale and completed in 2023, 17.2% were sold before construction started, 41.8% sold while under construction, 15.6% sold during the month of completion, and 19.7% sold after completion. The share of completed houses remaining unsold was 5.8% at point of survey.

Discover more from Eye On Housing

Subscribe to get the latest posts sent to your email.


This article was originally published by a eyeonhousing.org . Read the Original article here. .


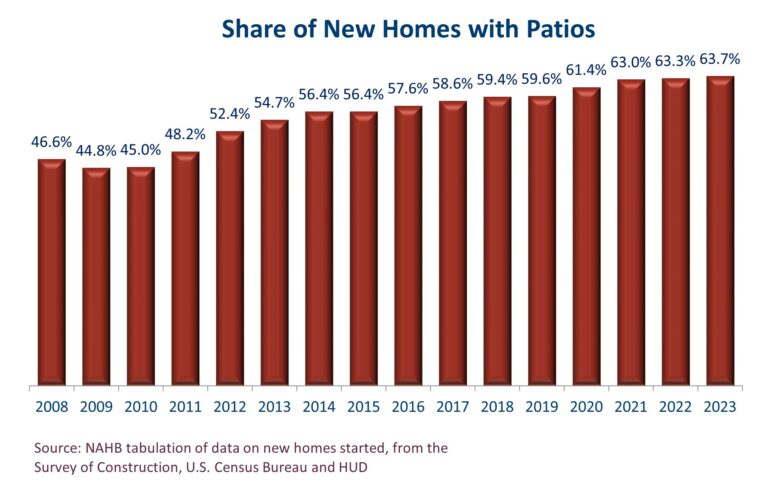
The share of new homes with patios increased to yet another record high in 2023. Of the roughly 950,000 single-family homes started during the year, 63.7% came with patios. This is up from 63.3% in 2022 and marks the eighth consecutive year the percentage set a new record high. The source for these numbers is NAHB tabulation of data from the Survey of Construction (conducted by the U.S. Census Bureau with partial funding from the Department of Housing and Urban Development).

Historically, fewer than half of new homes came with patios during the 2008-2011 period of extreme weakness in housing markets. But soon thereafter, the share jumped to 52.4% in 2012 and has been climbing ever since. The percentage has now increased in thirteen of the past fourteen years. The only exception was 2015, when the percentage was unchanged.

While patios for new homes have generally become more common over time, the parts of the country where they tend to be most common have remained consistent. At the low end, only 17% percent of new single-family homes built in New England and 20% in the Middle Atlantic came with patios in 2023. At the high end, the incidence of patios on new homes was over 80% in the West South Central and close to 70% in the South Atlantic and Mountain divisions. The geographic tendencies are similar to the ones reported in last year’s post.

Additional detail on the characteristics of new-home patios is available from the Annual Builder Practices Survey (BPS) conducted by Home Innovation Research Labs.

For the U.S. as a whole, the 2024 BPS report (based on homes built in 2023, like the SOC-based statistics cited above) shows that the average size of a new-home patio is about 290 square feet, but with considerable geographic variation. The average is over 400 square feet in the East South Central and about 380 square feet in New England; but under 200 square feet in the West South Central, and only a little over 200 square feet in the adjacent West North Central division.

In most parts of the country, poured concrete dominates all other building materials used in new-home patios. In the East South Central, for instance, poured concrete accounts for over 90% of new-home patios on a square-foot basis. To the extent that there are exceptions, they occur on the east coast. In the South Atlantic, concrete and brick pavers each have about a quarter of the market, and poured concrete has less than half. In New England, the market is more or less equally divided among poured concrete, concrete pavers and natural stone. In the Mid-Atlantic, brick pavers are the most popular choice for new-home patios by a substantial margin.

Discover more from Eye On Housing

Subscribe to get the latest posts sent to your email.


This article was originally published by a eyeonhousing.org . Read the Original article here. .


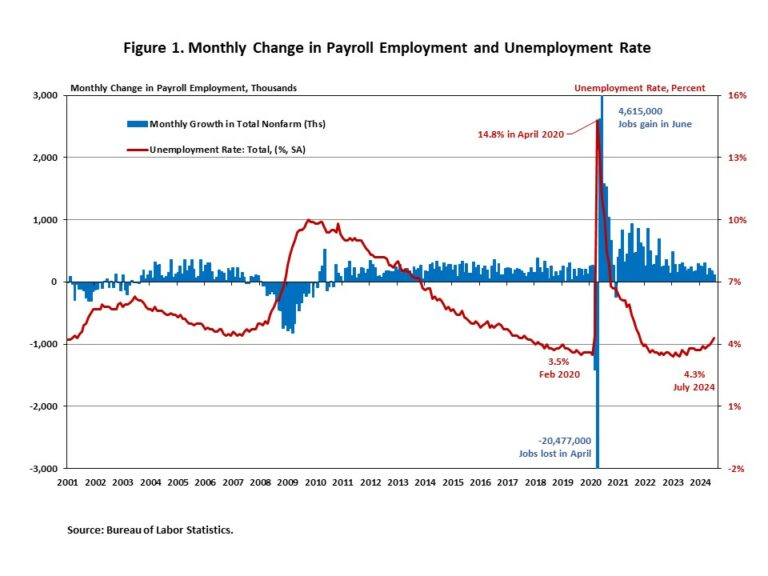
In July, job growth decelerated significantly, and the unemployment rate increased to a nearly three-year high of 4.3%. The July data indicates that the labor market is slowing, which signals monetary policy easing in the months ahead.

Additionally, wage growth slowed for the second month in a row. In July, wages grew at a 3.6% year-over-year (YOY) growth rate, down 1.0 percentage point from a year ago. This marks the lowest YOY wage gain in the past four years.

Total nonfarm payroll employment increased by 114,000 in July, following a downwardly revised increase of 179,000 jobs in June, as reported in the Employment Situation Summary. The estimates for the previous two months were revised down. The monthly change in total nonfarm payroll employment for May was revised down by 2,000, from +218,000 to +216,000, while the change for June was revised down by 27,000 from +206,000 to +179,000. Combined, the revisions were 29,000 lower than the original estimates.

Despite restrictive monetary policy, nearly 7.8 million jobs have been created since March 2022, when the Fed enacted the first interest rate hike of this cycle. In the first seven months of 2024, 1,419,000 jobs were created. Additionally, monthly employment growth averaged 203,000 per month, compared with the 251,000 monthly average gain for 2023.

In July, the unemployment rate rose for the fourth straight month to 4.3%, the highest rate since October 2021. The number of unemployed persons rose by 352,000, while the number of employed persons was barely changed.

Meanwhile, the labor force participation rate, the proportion of the population either looking for a job or already holding a job, rose 1.0 percentage point to 62.7% for July. Moreover, the labor force participation rate for people aged between 25 and 54 ticked up to 84.0%, the highest level since March 2001. While the overall labor force participation rate is still below its pre-pandemic levels at the beginning of 2020, the rate for people aged between 25 and 54 exceeds the pre-pandemic level of 83.1%.

For industry sectors, health care (+55,000), construction (+25,000), and transportation and warehousing (+14,000) have notable job gains in July, while information employment lost 20,000 jobs.

Employment in the overall construction sector increased by 25,000 in July, after 20,000 gains in June. While residential construction gained 9,100 jobs, non-residential construction employment added 16,200 jobs for the month.

Residential construction employment now stands at 3.4 million in July, broken down as 950,000 builders and 2.4 million residential specialty trade contractors. The 6-month moving average of job gains for residential construction was 6,067 a month. Over the last 12 months, home builders and remodelers added 67,600 jobs on a net basis. Since the low point following the Great Recession, residential construction has gained 1,387,400 positions.

In July, the unemployment rate for construction workers rose to 4.4% on a seasonally adjusted basis. The unemployment rate for construction workers remained at a relatively lower level, after reaching 15.3% in April 2020, due to the housing demand impact of the COVID-19 pandemic.

Discover more from Eye On Housing

Subscribe to get the latest posts sent to your email.


This article was originally published by a eyeonhousing.org . Read the Original article here. .

Pin It