Tag

Continue

Browsing


Home price growth continued to slow in October, growing at a rate of 3.60% year-over-year, according to the S&P CoreLogic Case-Shiller Home Price Index (seasonally adjusted – SA). This marks a decline from the 3.90% growth rate recorded in September and represents the seventh consecutive drop in the annual growth rate since reaching a peak of 6.54% in March 2024. As shown in the graph below, the index level has experienced monthly declines since July. 

By Metro Area

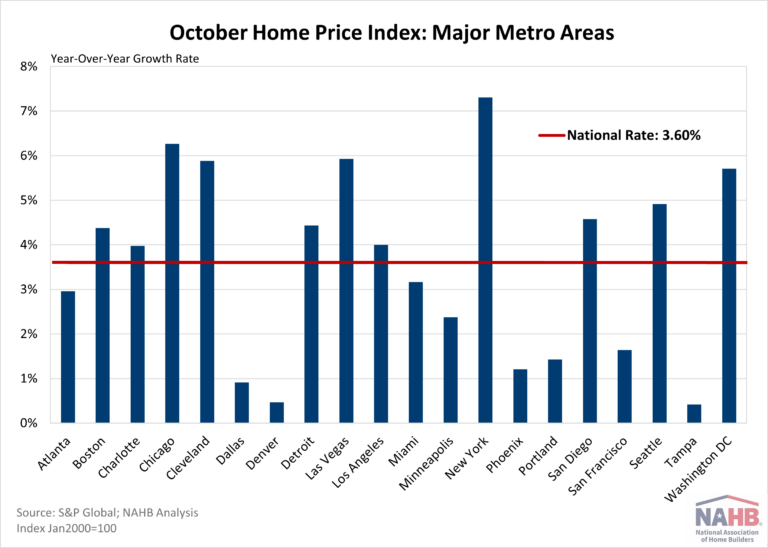
In addition to tracking national home price changes, the S&P CoreLogic Index (SA) also reports home price indexes across 20 metro areas. Compared to last year, all 20 metro areas reported a home price increase.  There were 11 metro areas that grew more than the national rate of 3.60%. The highest annual rate was New York at 7.31%, followed by Chicago at 6.27% and Las Vegas at 5.93%. The smallest home price growth over the year was seen by Tampa at 0.41%, followed by Denver at 0.47%, and Dallas at 0.91%. 

By Census Division

A similar index, the Federal Housing Finance Agency Home Price Index (SA) publishes not only national data but also data by census division. The national year-over-year rate was 4.43% for October. Meanwhile, the division with the highest year-over-year rate was 6.95% in the Middle Atlantic, while the lowest was 2.30% in the Pacific. A three-month trend in rates is shown for each division below. The FHFA Home Price Index releases their metro and state data on a quarterly basis, which NAHB analyzed in a previous post. 

Discover more from Eye On Housing

Subscribe to get the latest posts sent to your email.


This article was originally published by a eyeonhousing.org . Read the Original article here. .

The Market Composite Index, a measure of mortgage loan application volume by the Mortgage Bankers Association’s (MBA) weekly survey, decreased 14.5%, month-over-month, in November on a seasonally adjusted (SA) basis. The slowdown in mortgage activity can be attributed to higher mortgage rates as the ten-year Treasury yield increased in November, reflecting uncertainties surrounding the elections.

The market decline was reflected primarily in the Refinance Index (SA), which decreased by 33.2% month-over-month. Meanwhile, the Purchase Index (SA) showed a modest increase of 2.7% over the same period. However, compared to October 2023, the Market Composite Index is up by 16.4%, with the Purchase Index seeing a slight 4.8% increase and the Refinance Index higher by 45.9%.

The average contract rate for 30-year fixed mortgage rate per the MBA survey for November averaged at 6.8%, 29 basis points (bps) higher month-over-month in response to a higher ten-year Treasury rate.

Loan size metrics also reflected market adjustments. The average loan size for the total market (including purchases and refinances) shrank 2.9% month-over-month on a non-seasonally adjusted (NSA) basis, decreasing from $389,800 to $378,400. Loan sizes for purchasing and refinancing decreased. Purchase loans averaged $436,200, down 2.7% from $448,300, while refinance loans saw a sharper 9.9% decrease, with the average loan size falling from $322,500 to $290,600. Adjustable-rate mortgages (ARMs) also declined 6.0%, from $1.15 million to $1.08 million.

Discover more from Eye On Housing

Subscribe to get the latest posts sent to your email.


This article was originally published by a eyeonhousing.org . Read the Original article here. .

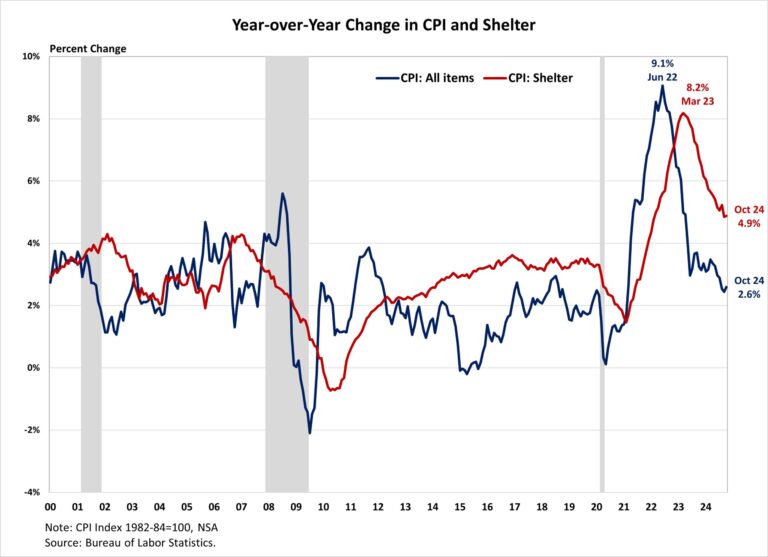
Inflation picked up again in October, showing the last mile to the 2% target will be the hardest. Shelter costs remained the main driver of inflation, accounting for over 65% of the 12-month increase in the all items less food and energy index. However, the year-over-year change in the shelter index has been below 5% for the second consecutive month, signaling some moderation in housing inflation.

While the Fed’s interest rate cuts could help ease some pressure on the housing market, its ability to address rising housing costs is limited, as these increases are driven by a lack of affordable supply and increasing development costs. In fact, tight monetary policy hurts housing supply because it increases the cost of AD&C financing. This can be seen on the graph below, as shelter costs continue to rise at an elevated pace despite Fed policy tightening. Additional housing supply is the primary solution to tame housing inflation.

Furthermore, the 2024 election result has put inflation back in the spotlight and added some downside risks to the economic outlook. Proposed tax cuts and tariffs could increase inflationary pressures, suggesting a more gradual easing cycle with a slightly higher terminal federal funds rate. Given the housing market’s sensitivity to interest rates, this could extend affordability crisis and constrain housing supply as builders continue to grapple with lingering supply chain challenges.

The Bureau of Labor Statistics reported that the Consumer Price Index (CPI) rose by 0.2% in October on a seasonally adjusted basis, the same increase seen over the previous three months. Excluding the volatile food and energy components, the “core” CPI increased by 0.3% in October, the same increase as in August and September.

The price index for a broad set of energy sources remained unchanged in October, with declines in gasoline (-0.9%) and fuel oil (-4.6%) offset by increases in electricity (+1.2%) and natural gas (+0.3%). Meanwhile, the food index rose 0.2%, after a 0.4% increase in September. The index for food away from home increased by 0.2% and the index for food at home rose by 0.1%.

The index for shelter (+0.4%) was the largest contributor to the monthly increase in all items index, accounting for over 50% of the total increase. Other top contributors that rose in October include indexes for used cars and trucks (+2.7%), airline fares (+3.2%), medical care (+0.3%) and recreation (+0.4%). Meanwhile, the top contributors that experienced a decline include indexes for apparel (-1.5%), communication (-0.6%) and household furnishings and operations (-0.1%).

The index for shelter makes up more than 40% of the “core” CPI. The index saw a 0.4% rise in October, following an increase of 0.2% in September. The indexes for owners’ equivalent rent (OER) and rent of primary residence (RPR) increased by 0.4% and 0.3% over the month. These gains have been the largest contributors to headline inflation in recent months. 

During the past twelve months, on a non-seasonally adjusted basis, the CPI rose by 2.6% in October, following a 2.4% increase in September. The “core” CPI increased by 3.3% over the past twelve months, the same increase as in September. The food index rose by 2.1%, while the energy index fell by 4.9%.

NAHB constructs a “real” rent index to indicate whether inflation in rents is faster or slower than overall inflation. It provides insight into the supply and demand conditions for rental housing. When inflation in rents is rising faster than overall inflation, the real rent index rises and vice versa. The real rent index is calculated by dividing the price index for rent by the core CPI (to exclude the volatile food and energy components).

In October, the Real Rent Index remained unchanged for the second consecutive month. Over the first ten months of 2024, the monthly growth rate of the Real Rent Index averaged 0.1%, slower than the average of 0.2% in 2023.

Discover more from Eye On Housing

Subscribe to get the latest posts sent to your email.


This article was originally published by a eyeonhousing.org . Read the Original article here. .

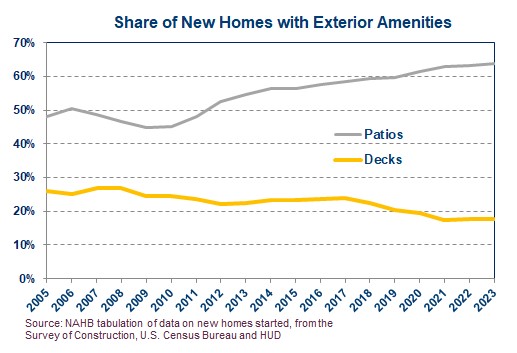
While the share of new homes with patios continues to climb, the share with decks has hovered at a historic low of under 18%, according to NAHB tabulation of data from the HUD/Census Bureau Survey of Construction (SOC).

Every year from the re-design of the SOC in 2005 through 2018, over 22% of single-family homes started featured decks. After that, however, the share dropped significantly, reaching a low of 17.5% in 2021. Since then, the percentage has remained near that trough, at 17.7% in 2022 and 17.6% in 2023. Moreover, this has been occurring at the same time the share of new homes with patios was climbing to a record high 67.7%. In fact, the tendency of deck and patio percentages to move in opposite directions is evident throughout the 2005-2023 period. The correlation between the percentages over that span is -0.84, suggesting that patios on new homes have been functioning as a substitute for decks. When more new homes have patios, fewer have decks.

New homes with both a deck and patio do occur but are comparatively rare. Among single-family homes started in 2023, fewer than 6% featured both a deck and a patio.

Decks have been more common not only when but where patios are less common. For example, among single-family homes started in 2023, patios were least common (featured ion only 17% of the homes) in the New England Census Division, the same division where a high of 76% of the homes featured decks. At the other extreme, in the West South Central a divisional high 81% of new homes featured patios in 2023, and a divisional low of 3% featured decks. Across all nine divisions in 2023, the correlation between the percentages of new homes with decks and patios was -0.82.

Nevertheless, decks remain relatively popular on new homes in some parts of the country. Following the 76% in New England at a distance, 42% of new homes featured decks in 2023 in both the Middle Atlantic and West North Central divisions.

More detail on new home deck construction is available from the Annual Builder Practices Survey (BPS) conducted by Home Innovation Research Labs.

Nationally, the 2024 BPS report (based on homes built in 2023) shows that the average size of a deck on a new single-family home is 284 square feet. Across Census divisions, the average size ranges from a low of 230 square feet in New England to a high of 382 square feet in the adjacent Middle Atlantic.

On a square foot basis, the BPS shows an evolving geographic split in the material builders use most often in deck construction. In the West North Central, South Atlantic, East South Central and West South Central divisions, treated wood remains the top choice. In the New England, Middle Atlantic, East North Central and Mountain divisions, composite material has moved ahead of treated wood; while in the Pacific Division, concrete edged out composite for the top spot. The Pacific is also the only division where redwood (a species that can be used outdoors without special pressure treatment) is relatively common in new home deck construction.

A previous post covered the characteristics of patios on single-family homes built in 2023.

Discover more from Eye On Housing

Subscribe to get the latest posts sent to your email.


This article was originally published by a eyeonhousing.org . Read the Original article here. .


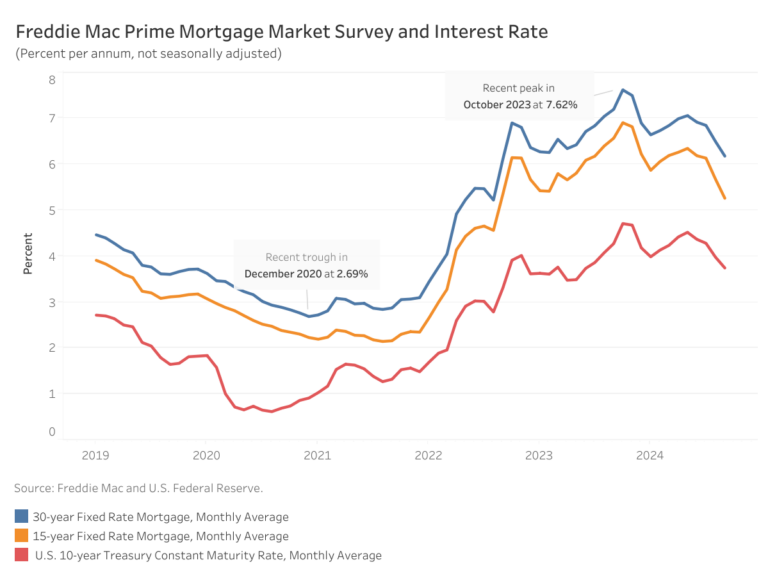
In September, mortgage rates maintained their downward trajectory, returning to levels last seen two years ago. According to Freddie Mac, the average rate for a 30-year fixed-rate mortgage fell to 6.18%, a decline of 32 basis points (bps) from August. The 15-year fixed-rate mortgage saw an even steeper decline, decreasing by 42 bps from August to 5.26%. Additionally, the 10-year Treasury rate declined by 23 bps, falling from 3.98% in August to 3.75%.

According to the NAHB forecast, the 30-year mortgage rate is expected to near 6% on a sustained basis by the end of 2024, with a further decline to just below 6% during 2025. NAHB also predicts furthering easing by the Federal Reserve before the end of 2024.

Discover more from Eye On Housing

Subscribe to get the latest posts sent to your email.


This article was originally published by a eyeonhousing.org . Read the Original article here. .

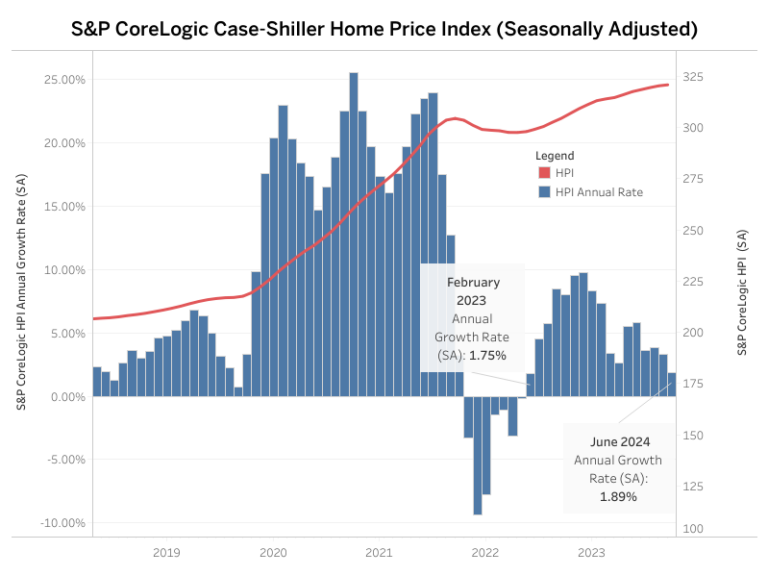
Home price growth continues to decelerate, according to the recent release of the S&P CoreLogic Case-Shiller Home Price Index (HPI). The S&P CoreLogic Case-Shiller HPI increased at a seasonally adjusted annual rate of 1.89% for June 2024, slowing from a revised rate of 3.28% in May. Home prices have not seen an outright decrease since January of 2023. However, 1.89% is the smallest growth in prices since February of 2023. Additionally, the growth rate has shown a generally declining trend since a peak of 9.76% in August 2023.

Meanwhile, the Home Price Index released by the Federal Housing Finance Agency (FHFA; SA), recorded a decline in home prices for June. The index declined at an annual rate of -1.04% for June, decreasing from a revised 0.51% rate in May. The FHFA Index has experienced just one other decrease since August of 2022, with a decline of -1.03% in January 2024.

Year-Over-Year

Home prices experienced a fourth year-over-year deceleration in June, tabulated by both indexes. The S&P CoreLogic Case-Shiller HPI (not seasonally adjusted – NSA) posted a 5.42% annual gain in June, down from a 5.94% increase in May. Since June of 2023, the index has seen steady increases in the year-over-year growth rate. However, this growth rate began slowing in March of 2024 and has continued to decelerate through June. Meanwhile, the FHFA HPI (NSA) index rose 5.23%, down from 5.95% in May. This rate has decelerated from 7.19% in February.

By Metro Area

In addition to tracking national home price changes, the S&P CoreLogic Index (NSA) also reported home price indexes across 20 metro areas in May. At an annual rate, five out of 20 metro areas reported home price declines: Phoenix at -3.02%, Portland at -2.90%, Dallas at -0.69%, Charlotte at -0.56%, and Miami at -0.03%. Among the 20 metro areas, thirteen exceeded the national rate of 1.89%. Seattle had the highest rate at 10.80%, followed by San Diego at 9.18%, and then Los Angeles at 7.89%. The monthly trends are shown in the graph below.

By Census Division

Monthly, the FHFA HPI (SA) releases not only national data but census division data as well. Out of the nine census divisions, seven posted negative monthly depreciation (adjusted to an annual rate) for June, ranging from -7.59% in the Mountain division to -0.82% in the Middle Atlantic. The remaining two divisions with positive home price appreciation were East South Central at 8.66% and the South Atlantic at 3.09%. The FHFA HPI releases its metro and state data on a quarterly basis, which NAHB analyzes in a previous post.

Discover more from Eye On Housing

Subscribe to get the latest posts sent to your email.


This article was originally published by a eyeonhousing.org . Read the Original article here. .

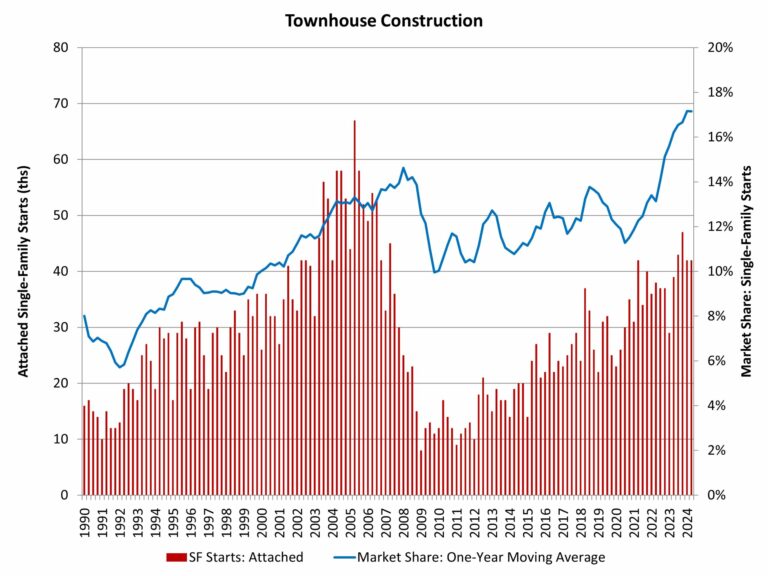
Year-over-year gains for townhouse construction continued during the second quarter 2024 as demand for medium-density housing continues to be solid despite slowing for other sectors of the building industry.

According to NAHB analysis of the most recent Census data of Starts and Completions by Purpose and Design, during the second quarter of 2024, single-family attached starts totaled 42,000, which is 8% higher than the second quarter of 2023. Over the last four quarters, townhouse construction starts totaled a strong 174,000 homes, which is 23% higher than the prior four-quarter period (142,000). Townhouses made up almost 15% of single-family housing starts for the second quarter of the year.

Using a one-year moving average, the market share of newly-built townhouses stood at 17.2% of all single-family starts for the second quarter. With recent gains, the four-quarter moving average market share remain at the highest on record, for data going back to 1985.

Prior to the current cycle, the peak market share of the last two decades for townhouse construction was set during the first quarter of 2008, when the percentage reached 14.6%, on a one-year moving average basis. This high point was set after a fairly consistent increase in the share beginning in the early 1990s.

The long-run prospects for townhouse construction are positive given growing numbers of homebuyers looking for medium-density residential neighborhoods, such as urban villages that offer walkable environments and other amenities. Where it can be zoned, it can be built.

Discover more from Eye On Housing

Subscribe to get the latest posts sent to your email.


This article was originally published by a eyeonhousing.org . Read the Original article here. .
Pin It