Tag

Construction

Browsing


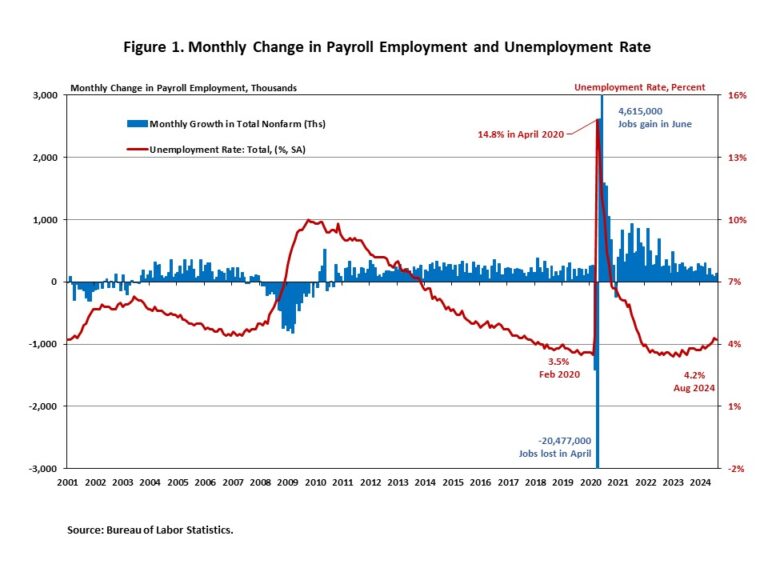
Today’s jobs report and the newly released preliminary estimate of the benchmark revision indicate that the U.S. labor market is slowing from its overheated state in 2021 and 2022 but remains stable. Among all sectors, construction led the August job gains, adding 34,000 jobs to payrolls.

Additionally, wage growth accelerated in August. Wages grew at a 3.8% year-over-year (YOY) growth rate, down 0.7 percentage points from a year ago. Wage growth is outpacing inflation, which typically occurs as productivity increases.

National Employment

Total nonfarm payroll employment increased by 142,000 in August, following a downwardly revised increase of 89,000 jobs in July, as reported in the Employment Situation Summary. The estimates for the previous two months were revised lower. The monthly change in total nonfarm payroll employment for June was revised down by 61,000, from +179,000 to +118,000, while the change for July was revised down by 25,000 from +114,000 to +89,000. Combined, the revisions were 86,000 lower than the original estimates.

Despite restrictive monetary policy, about 7.9 million jobs have been created since March 2022, when the Fed enacted the first interest rate hike of this cycle. In the first eight months of 2024, 1,475,000 jobs were created. Additionally, monthly employment growth averaged 184,000 per month, compared with the 251,000 monthly average gain for 2023.

In August, the unemployment rate eased slightly to 4.2%, from 4.3% in July. The August decrease in the unemployment rate reflected the decrease in the number of persons unemployed (-48,000) and the increase in the number of persons employed (+168,000).

Meanwhile, the labor force participation rate—the proportion of the population either looking for a job or already holding a job—remained at 62.7%. However, for people aged between 25 and 54, the participation rate dipped slightly to 83.9%. This rate exceeds the pre-pandemic level of 83.1%. Meanwhile, the overall labor force participation rate is still below its pre-pandemic levels when it stood at 63.3% at the beginning of 2020.

For industry sectors, construction (+34,000), health care (+31,000), and social assistance (+13,000) had job gains in August, while manufacturing lost 24,000 jobs. Employment in other major industries showed little change over the month.

Construction Employment

Employment in the overall construction sector in August (+34,000) experienced an increase, from the 13,000 job gains in July. While residential construction gained 5,600 jobs, non-residential construction employment added 28,300 jobs for the month.

Residential construction employment now stands at 3.4 million in August, broken down as 951,000 builders and 2.4 million residential specialty trade contractors. The 6-month moving average of job gains for residential construction was 5,667 a month. Over the last 12 months, home builders and remodelers added 63,100 jobs on a net basis. Since the low point following the Great Recession, residential construction has gained 1,385,000 positions.

In August, the unemployment rate for construction workers declined to 3.9% on a seasonally adjusted basis. The unemployment rate for construction workers has remained at a relatively lower level, after reaching 15.3% in April 2020, due to the housing demand impact of the COVID-19 pandemic.

Discover more from Eye On Housing

Subscribe to get the latest posts sent to your email.


This article was originally published by a eyeonhousing.org . Read the Original article here. .

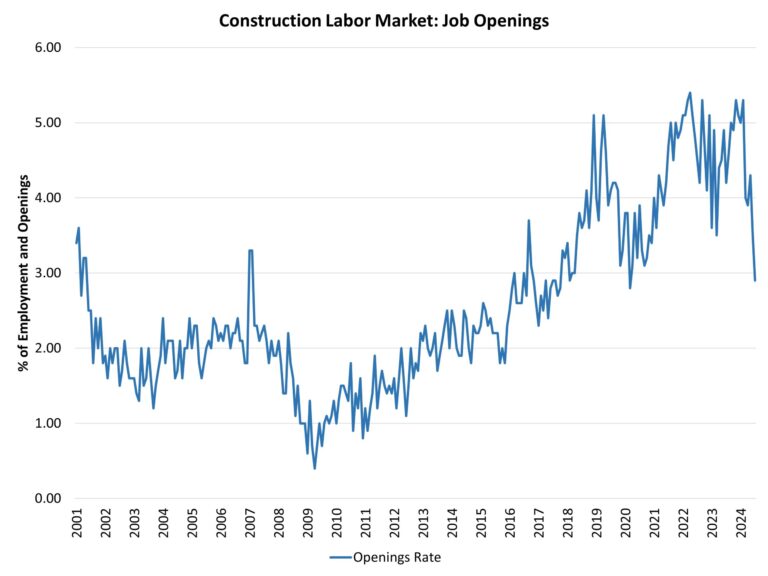
Due to slowing home construction and elevated interest rates, the count of open construction sector jobs continued to decline in July, per the Bureau of Labor Statistics’ Job Openings and Labor Turnover Survey (JOLTS). However, this shift lower is also consistent with a cooler overall labor market, which is a positive sign for future inflation readings and the interest rate outlook.

In July, after revisions, the number of open jobs for the overall economy decreased slightly from 7.91 million to 7.67 million. This is notably smaller than the 8.81 million estimate reported a year ago. Previous NAHB analysis indicated that this number had to fall below 8 million on a sustained basis for the Federal Reserve to feel more comfortable about labor market conditions and their potential impacts on inflation. With estimates now measurably below 8 million, interest rate cuts from the Federal Reserve are at hand (Indeed, the yield curve reversed its inversion for the first time since June 2022 today, although this reversion can also be a bond market signal for some concern for future macro data).

As the Fed eases monetary policy, the demand for new construction will expand. Thus, a reversal for the current soft readings for construction labor will occur in the quarters ahead. This means the underlying skilled labor shortage is likely to persist during the coming years.

In July, the number of open construction sector jobs shifted notably lower from 299,000 in June to 248,000. Elements of the construction sector have slowed as elevated interest rates held, most notably multifamily development. This slowing has somewhat reduced demand for construction workers, lowering the job opening count for the construction industry. The open job count was 351,000 a year ago.

The construction job openings rate fell to 2.9% in July, the lowest rate since March 2020. The job openings rate has trended lower as the number of single-family and multifamily residences under construction has declined. This is a cyclical effect that will likely reverse later in 2025.

The layoff rate in construction increased to 2.1% in July from 1.3% in June as the labor market slows. The quits rate in construction increased to 2.1% in July from 1.6% in June. The rise in the layoff rate is consistent with a slowing construction labor market.

Discover more from Eye On Housing

Subscribe to get the latest posts sent to your email.


This article was originally published by a eyeonhousing.org . Read the Original article here. .

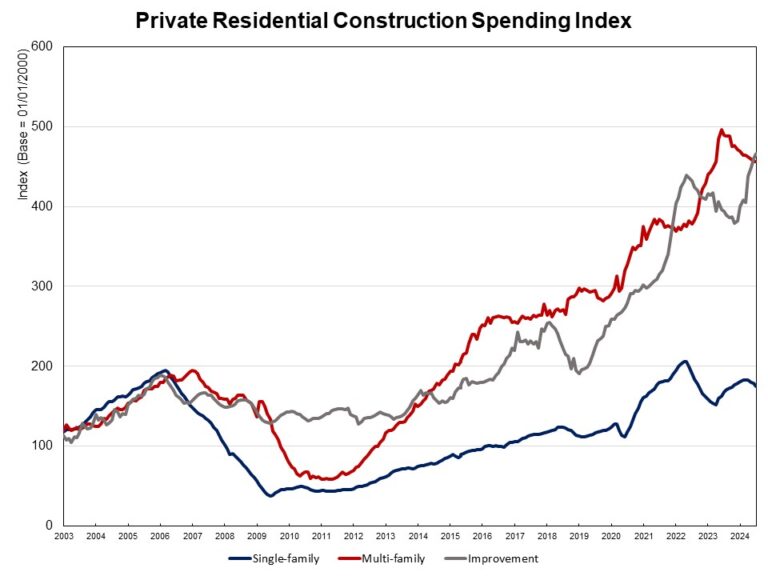
Private residential construction spending fell 0.4% in July, according to the Census Construction Spending data. Nevertheless, spending remained 7.7% higher compared to a year ago. The monthly decline in total private construction spending for July was largely due to reduced spending on single-family construction. Spending on single-family construction plunged by 1.9% in July, following a dip of 1.1% in June. This marks the fourth consecutive monthly decrease. Elevated mortgage interest rates have cooled the housing market, dampening home builder confidence and new home starts. Despite these challenges, spending on single-family construction was still 4% higher than it was a year earlier.

Multifamily construction spending stayed flat in July after a dip of 0.6% in June. Year-over-year, spending on multifamily construction declined 6.7%, as an elevated level of apartments under construction is being completed. Private residential improvement spending increased 1.2% in July and was 18.3% higher compared to a year ago.

The NAHB construction spending index is shown in the graph below (the base is January 2000). The index illustrates how spending on single-family construction has slowed down the pace since early 2024 under the pressure of elevated interest rates. Multifamily construction spending growth slowed down after the peak in July 2023, while improvement spending increased its pace since late 2023.

Spending on private nonresidential construction was up 4.5% over a year ago. The annual private nonresidential spending increase was mainly due to higher spending for the class of manufacturing ($39.7 billion), followed by the power category ($1 billion).

Discover more from Eye On Housing

Subscribe to get the latest posts sent to your email.


This article was originally published by a eyeonhousing.org . Read the Original article here. .

The cost per square foot of a single-family home declines systematically as the home becomes larger, according to NAHB analysis of two recent data sources. In microeconomics, unit costs that decline as a business operation increases in size are called economies of scale.

In home building, economies of scale may exist in several forms. It is conceivable, for instance, that homes cost less if they are built in larger subdivisions, or by larger companies, where design costs may be spread over a large number of production units. This post, however, focuses on economies of scale at the level of an individual home. In other words, does cost per square foot decline, all else equal, as a home increases in size?

The answer is yes, according to NAHB tabulation of data from the Survey of Construction (conducted by the U.S. Census Bureau with partial funding from the Department of Housing and Urban Development). Last Friday’s post reported on how the sale price per square foot of new single-family detached homes varies across time and geography. The chart below shows how it varies with the size of the home (measured in square footage of finished floor space). It is easy to see that the median price declines systematically, from a high of $200 per square foot for homes under 1,200 square feet to a low of only $132 per square foot for homes with 5,000 square feet or more.

There could be several reasons for this. A conventional explanation is that some components of construction cost—for example, design, regulatory and waste disposal costs—may be more or less fixed and not change much with house size.

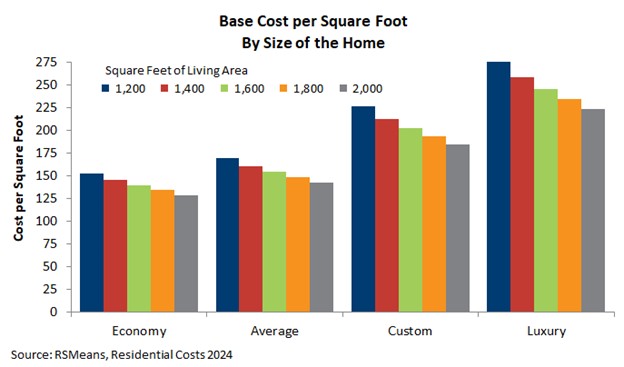
The above sale price numbers are calculated after subtracting the value of the improved lot, but do not otherwise control for differences in quality or amenities present in the homes. One of the private services that does carefully control for quality and amenities when estimating construction costs per square foot is RSMeans. The chart below shows the base cost per square foot for a two-story home in each of the four RSMeans quality tiers: Economy, Average, Custom and Luxury.

Within each tier, characteristics of the home (other than square footage) are held constant. The “Average” two-story home, for instance, has a simple design from standard plans, no basement, a kitchen, single full bathroom, asphalt shingles on the roof, wood framing, wood siding, gypsum wallboard interior, and average quality materials and workmanship. As in the previous chart, cost per square foot declines systematically as the house gets bigger. Although the rate of decline varies, at the low end of the size scale, doubling the size of the home reduces the base cost per square foot by somewhere in the neighborhood of 30 percent. Interested readers may consult RSMeans for further details.

The bottom line is that economies of scale are ubiquitous in new single-family homes throughout both the Census sale price and private cost estimating data. This is significant due to the volume of queries NAHB fields about construction costs. Almost invariably, the queries ask for cost per square foot. To avoid large errors, it is important the requesters realize that the number will change depending on the size of the home. If you apply cost per square foot for a 3,000 square-foot home to a home with only 1,500 square feet, for instance, you will drastically underestimate the home’s total cost. Ideally, this post will be able to serve as a reference in these situations.

Discover more from Eye On Housing

Subscribe to get the latest posts sent to your email.


This article was originally published by a eyeonhousing.org . Read the Original article here. .

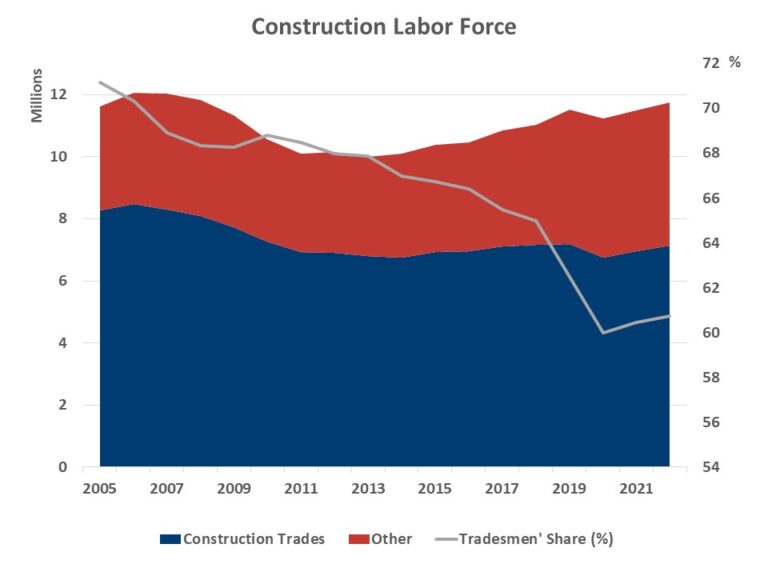
Analysis of the history of data from the American Community Survey (ACS) reveals dramatic shifts in the makeup of the construction labor force over the last two decades. While the overall count of workers in the industry now approaches the historic highs of the housing boom of 2005-2006, the share of tradesmen declined from 71% in 2005 to under 61% in 2022. At the same time, the share of computer, engineering, and science occupations doubled, and the share of management and business occupations increased 60%.

The results are noteworthy, particularly given a recent focus on relatively flat productivity growth in the construction sector. A growing count of engineering/tech workers would, on its face, suggest a boost to productivity. However, a decline for the share of workers associated with the trades could suggest declining productivity. Indeed, more workers in management and business occupations could be another impact of the rising regulatory burden associated with building. These findings and possible impacts deserve additional research attention given the need to supply more attainable housing to the market.

As of 2022, the construction labor force exceeds 11.7 million, just slightly below the housing boom peak of 12 million. Construction trades (such as carpenters, electricians, painters, plumbers, laborers, as well as first-line supervisors) account for 7.1 million workers in the industry, or 60.7%. In contrast, there were 8.5 million construction tradesmen during the peak employment of 2006. The disappearance of more than a million craftsmen helps explain the persistent labor shortages reported by the NAHB/Wells Fargo Housing Market Index Survey.

Over the same period, the construction industry absorbed a rising number of white-collar workers. The management ranks expanded from 1.2 million to 1.9 million workers, and their share increased from 10% to 16%. Business and financial occupations grew at similar rates. The number of engineers, architects and other science occupations doubled; they now account for close to 2.7% of the industry workforce. In contrast, the share of computer, engineering and science occupations was just 1.3% in 2005.

Even though the prevalence of white-collar jobs in construction remains less common than in the US economy overall, their numbers and shares have been rising faster in construction since 2005. For example, while the share of computer, engineering, and science occupations doubled in construction, it increased only 40% in the overall US workforce. Similarly, whereas the management ranks increased 60% in construction, they grew at a slower rate for the US labor force and registered gains of 45% since 2005.

The rising presence of white-collar workers in construction undoubtedly reflects evolving production technologies, an enhanced regulatory environment and more stringent building codes. The changing makeup of the construction workforce also coincides with the declining rates of self-employment in the industry and may reflect a shift towards larger construction firms. Larger building enterprises are better equipped to invest into new technologies and absorb higher overhead costs.

The labor force statistics reported in the post are tabulated using the historic ACS Public Use Microdata Sample (PUMS). The ACS statistics are most comprehensive as they include payroll workers, as well as self-employed. As the common practice dictates, the labor force estimates count employed and those unemployed workers who look for jobs.

Discover more from Eye On Housing

Subscribe to get the latest posts sent to your email.


This article was originally published by a eyeonhousing.org . Read the Original article here. .

The labor market may not be as strong as previously estimated, according to the Bureau of Labor Statistics’ preliminary estimate of the upcoming annual benchmark revision to the establishment survey employment series. Each year, the Current Employment Statistics (CES) survey employment estimates are benchmarked to full population counts of employment for the month of March. It improves the accuracy of the CES all-employee series and provides an early look at adjustments to employment data.

According to the preliminary estimate of the benchmark revision, total payroll employment for the period from April 2023 to March 2024 (12 months) was lowered by 818,000, about 0.5% less than previously estimated. If the final benchmark revision is not far off the preliminary one, this preliminary estimate of the upcoming annual benchmark revision would be the largest downward revision since March of 2009 (the 2009 revision was a reduction of 902,000 estimated jobs).

Additionally, while the CES data show that 2.9 million jobs were added from April 2023 to March 2024, the preliminary estimate of the benchmark revision suggests that job growth was overstated by about 40%. On a monthly basis, there were about 68,000 fewer jobs on average in the 12-month period through March 2024.

Among major industry sectors, five sectors saw an upward revision in employment, led by private education and health services (+87,000) and transportation and warehousing (+56,400). Meanwhile, professional and business services had the largest downward revision of 358,000 jobs, followed by leisure and hospitality shedding 150,000 jobs.

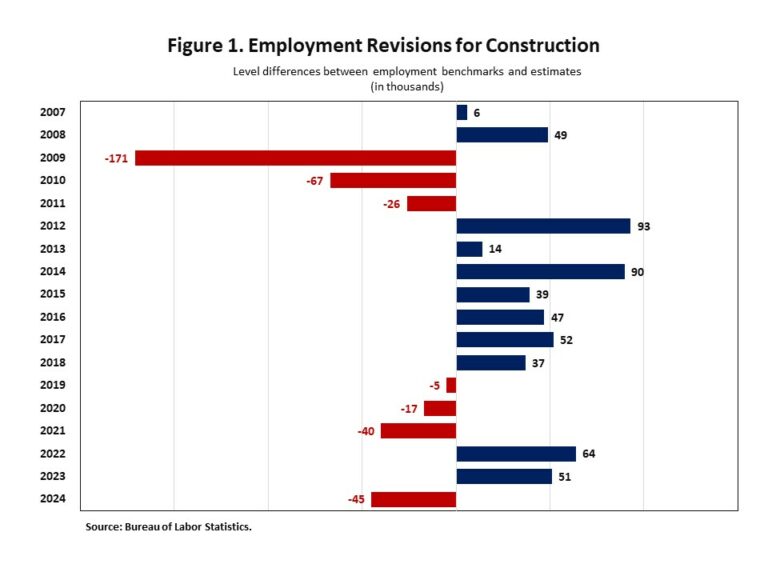
Closer to housing, construction employment was revised down by 45,000, 0.6% less than the initially reported 8.2 million jobs in place. The average monthly job gains for the construction sector were revised down by 17% to 18,000 jobs in the 12-month period through March 2024.

Figure 1 shows the level difference between revised employment data and previous estimates for the construction sector from 2007 to 2024. The red bars mark the downward revisions, while the blue bars present the upward revisions. From top to bottom, there are three consecutive red bars from 2009 to 2011, another three red bars from 2019 to 2021, and the last one in 2024.

During the period of the 2008 recession and the COVID-19 pandemic, construction employment was overestimated for three straight years, respectively. The current preliminary benchmark revision for the construction sector is the largest downward revision since March 2010.

Note: The existing employment data will not be updated with the release of the preliminary benchmark estimate. The data for all CES series will be updated when the final benchmark revision is issued in February 2025.

Discover more from Eye On Housing

Subscribe to get the latest posts sent to your email.


This article was originally published by a eyeonhousing.org . Read the Original article here. .

Single-family built-for-rent construction posted year-over-year gains as of the second quarter of 2024, as builders sought to add additional rental housing in a market facing ongoing, elevated mortgage interest rates.

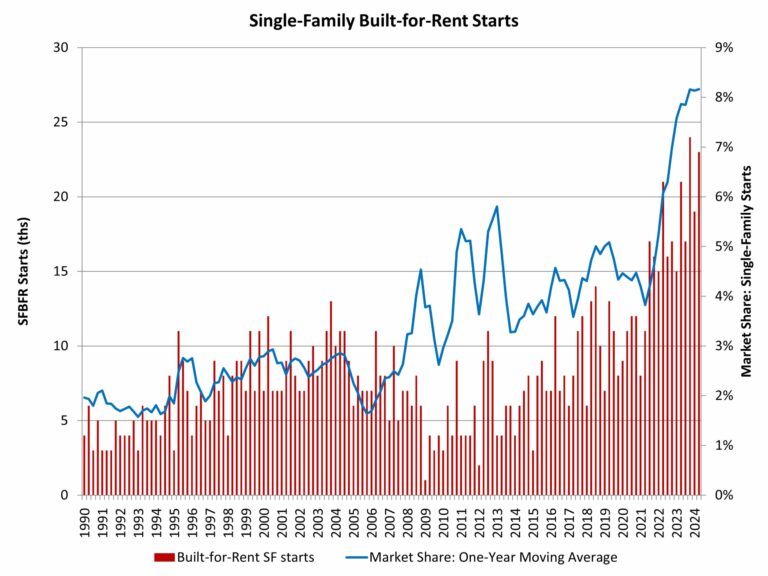
According to NAHB’s analysis of data from the Census Bureau’s Quarterly Starts and Completions by Purpose and Design, there were approximately 23,000 single-family built-for-rent (SFBFR) starts during the second quarter of 2024. This is almost 10% higher than the second quarter of 2023. Over the last four quarters, 83,000 such homes began construction, which is a more than 20% increase compared to the 69,000 estimated SFBFR starts in the four quarters prior to that period.

The SFBFR market is a source of inventory amid challenges over housing affordability and downpayment requirements in the for-sale market, particularly during a period when a growing number of people want more space and a single-family structure. Single-family built-for-rent construction differs in terms of structural characteristics compared to other newly-built single-family homes, particularly with respect to home size. However, investor demand for single-family homes, both existing and new, has cooled with higher interest rates. Nonetheless, builders continue to build projects of built-for-rent homes for their own operation.

Given the relatively small size of this market segment, the quarter-to-quarter movements typically are not statistically significant. The current four-quarter moving average of market share (8%) is nonetheless higher than the historical average of 2.7% (1992-2012).

Importantly, as measured for this analysis, the estimates noted above include only homes built and held by the builder for rental purposes. The estimates exclude homes that are sold to another party for rental purposes, which NAHB estimates may represent another three to five percent of single-family starts based on industry surveys.

The Census data notes an elevated share of single-family homes built as condos (non-fee simple), with this share averaging more than 3% over recent quarters. Some, but certainly not all, of these homes will be used for rental purposes. Additionally, it is theoretically possible some single-family built-for-rent units are being counted in multifamily starts, as a form of “horizontal multifamily,” given these units are often built on a single plat of land. However, spot checks by NAHB with permitting offices indicate no evidence of this data issue occurring.

Nonetheless, demand by investors for single-family rental units, new and existing, has cooled in recent quarters as financial conditions remain tight. This will continue to cool some investor demand for SFBFR housing.

With the onset of the Great Recession and declines for the homeownership rate, the share of built-for-rent homes increased in the years after the recession. While the market share of SFBFR homes is small, it has clearly expanded. Given affordability challenges in the for-sale market, the SFBFR market will likely retain an elevated market share even as the sector cools in the quarters ahead.

Discover more from Eye On Housing

Subscribe to get the latest posts sent to your email.


This article was originally published by a eyeonhousing.org . Read the Original article here. .

Year-over-year gains for townhouse construction continued during the second quarter 2024 as demand for medium-density housing continues to be solid despite slowing for other sectors of the building industry.

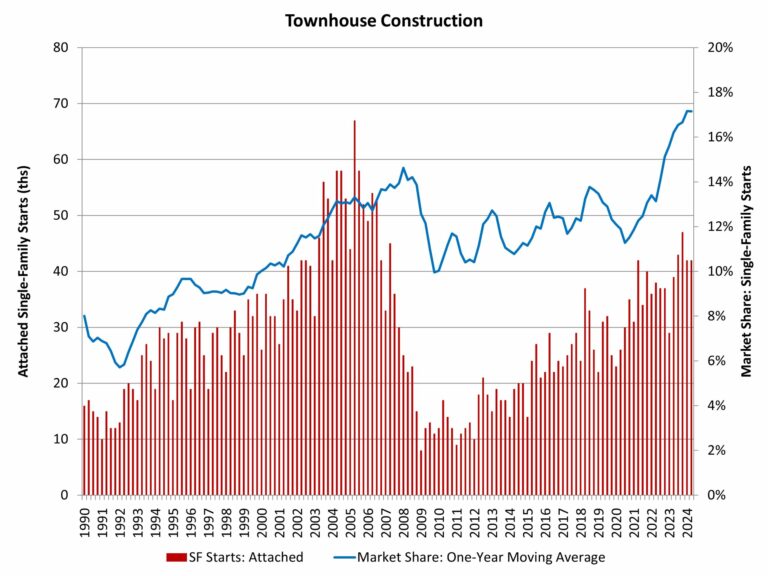
According to NAHB analysis of the most recent Census data of Starts and Completions by Purpose and Design, during the second quarter of 2024, single-family attached starts totaled 42,000, which is 8% higher than the second quarter of 2023. Over the last four quarters, townhouse construction starts totaled a strong 174,000 homes, which is 23% higher than the prior four-quarter period (142,000). Townhouses made up almost 15% of single-family housing starts for the second quarter of the year.

Using a one-year moving average, the market share of newly-built townhouses stood at 17.2% of all single-family starts for the second quarter. With recent gains, the four-quarter moving average market share remain at the highest on record, for data going back to 1985.

Prior to the current cycle, the peak market share of the last two decades for townhouse construction was set during the first quarter of 2008, when the percentage reached 14.6%, on a one-year moving average basis. This high point was set after a fairly consistent increase in the share beginning in the early 1990s.

The long-run prospects for townhouse construction are positive given growing numbers of homebuyers looking for medium-density residential neighborhoods, such as urban villages that offer walkable environments and other amenities. Where it can be zoned, it can be built.

Discover more from Eye On Housing

Subscribe to get the latest posts sent to your email.


This article was originally published by a eyeonhousing.org . Read the Original article here. .

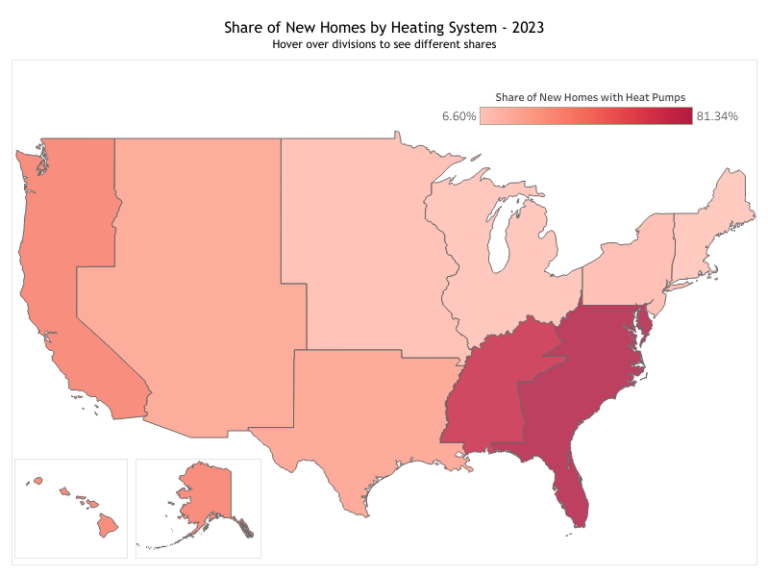
Almost all new single-family homes that started construction in 2023 used either an air/ground source heat pump or a forced air system (without heat pump) for the primary heating system (98% in 2023), according to the Census’s Survey of Construction.  While this survey data does not separate the air source heat pump systems and ground heat pump systems (geothermals), another study discusses their usage in green building. Additionally, 17% of homes used a secondary type of heating equipment. 

Heating Systems

The type of heating system installed varies significantly by Census Division. In warmer regions of the country, air/ground source systems are more common with an 81% share in the South Atlantic and a 72% share in the East South Central. In colder regions, very few homes have air or ground-source heat pumps: only 7% of new homes started in New England and only 8% in East North Central. Forced air systems without heat pumps burn fuel to produce heat, while heat pumps transfer heat by moving air. Therefore, in extreme climates (below freezing), heat pumps can become less efficient due to the limited ambient heat available.

In general, the share of new homes using an air or ground-source heat pump as the primary means of providing heat has increased, going from 23% in 2000 to 45% in 2023. Meanwhile, the share relying on a forced air system without heat pumps has slipped, going from 71% to 53% in the same time frame.

Primary Fuel for Heating

The SOC also provides data on the primary fuel used to heat new single-family homes. Approximately 54% of new homes started in 2023 use electricity as the primary heating fuel, compared to 43% powered by natural gas, 3% using bottle or liquified petroleum gas (propane), and 0.1% using oil.

Heating fuel sources closely align with the types of heating systems used, with air and ground-source heat pumps running on electricity and most forced air systems without heat pumps using natural gas or propane. Consequently, the primary heating fuel source differs significantly by region across the country. For example, in New England only 10% of new homes used electricity as the primary heating source. In contrast, 83% of new homes started in the South Atlantic use it. Additionally, while most regions fall under 10% in their usage of propane, New England had a 29% share and East North Central had 11%.

Air Conditioning

In 2023, 98% of new single-family homes started had a central AC system, rising from 97.1% in 2022. This percentage has risen steadily since 2000 when only 85.5% of homes had a central AC system.

Though the share of new single-family homes started with central AC differs across the country’s nine Census divisions, the highest share is concentrated in the South region: 100% of homes started in the South Atlantic, East South Central, and West South Central divisions had central AC installed. Closely falling behind were the West North Central and Pacific Divisions, both at 98%. Trailing last were the Middle Atlantic (95%), East North Central (94%), Mountain (93%), and New England (89%) divisions.

Discover more from Eye On Housing

Subscribe to get the latest posts sent to your email.


This article was originally published by a eyeonhousing.org . Read the Original article here. .

Private residential construction spending was down 0.3% in June, after a dip of 0.7% in the prior month, according to the Census Construction Spending data. Nevertheless, it remained 7.3% higher compared to a year ago.

The monthly decline in total private construction spending for June was largely due to reduced spending on single-family construction. Spending on single-family construction fell by 1.2% in June, following a dip of 0.6% in May. This marks the third consecutive monthly decrease. Elevated mortgage interest rates have cooled the housing market, dampening home builder confidence and new home starts. Despite this, spending on single-family construction was still 9.9% higher than it was a year earlier.

Multifamily construction spending inched up 0.1% in June after a dip of 0.6% in May. Year-over-year, spending on multifamily construction declined 7.4%, as an elevated level of apartments under construction is being completed. Private residential improvement spending increased 0.6% in June and was 10.4% higher compared to a year ago.

The NAHB construction spending index is shown in the graph below (the base is January 2000). The index illustrates how spending on single-family construction and home improvements have slowed down the pace since early 2024 under the pressure of elevated interest rates. Multifamily construction spending growth slowed down after the peak in June 2023.

Spending on private nonresidential construction was up 4.2% over a year ago. The annual private nonresidential spending increase was mainly due to higher spending for the class of manufacturing ($37.6 billion), followed by the power category ($13 billion).

Discover more from Eye On Housing

Subscribe to get the latest posts sent to your email.


This article was originally published by a eyeonhousing.org . Read the Original article here. .

Pin It