Tag

Construction

Browsing


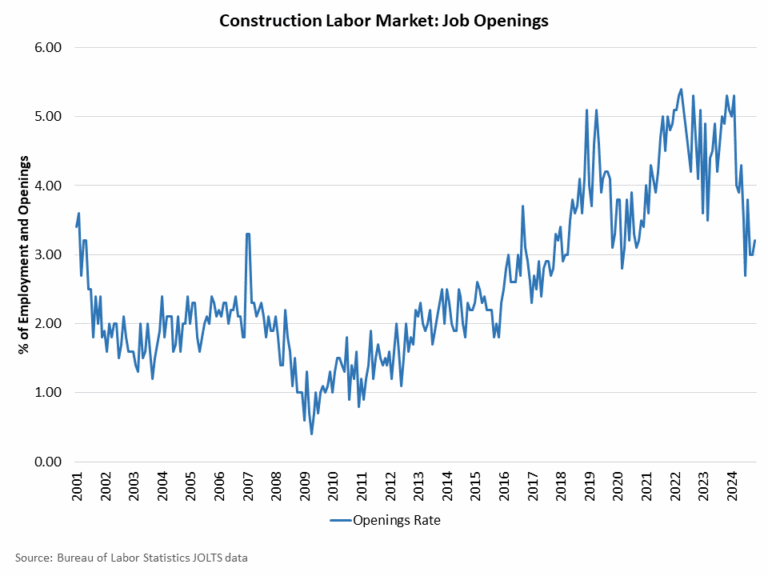
After a period of slowing associated with declines for some elements of the residential construction industry, the count of open construction sector jobs remained lower than a year ago, per the December Bureau of Labor Statistics Job Openings and Labor Turnover Survey (JOLTS).

The number of open jobs for the overall economy decreased from 8.16 million in November to 7.6 million in December. This is notably smaller than the 8.89 million estimate reported a year ago and reflects a softened aggregate labor market. Previous NAHB analysis indicated that this number had to fall below 8 million on a sustained basis for the Federal Reserve to feel more comfortable about labor market conditions and their potential impacts on inflation. With estimates remaining below 8 million for national job openings, the Fed in theory should be able to cut further despite a recent pause.

The number of open construction sector jobs decreased from a revised 272,000 in November to just 217,000 in December. This marks a significant reduction of open, unfilled construction jobs than that registered a year ago (434,000) due to a slowing of construction activity because of elevated interest rates.

The construction job openings rate moved lower to 2.5% in December, significantly down year-over-year from 5.1%. This is the lowest open rate for the construction sector since 2017.

The layoff rate in construction stayed low (1.8%) in December. The quits rate moved lower to 1.4% in December. This is the lowest quits rate for construction since the third quarter of 2020.

Discover more from Eye On Housing

Subscribe to get the latest posts sent to your email.


This article was originally published by a eyeonhousing.org . Read the Original article here. .


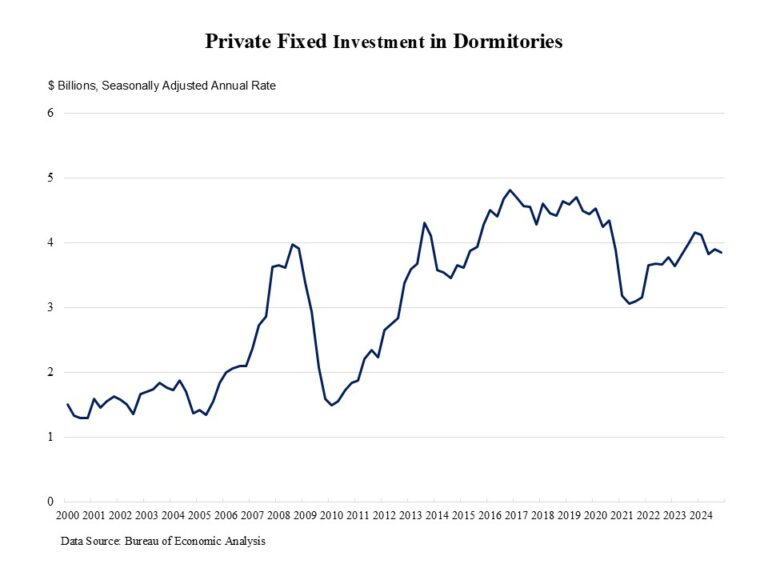
Private fixed investment in student dormitories edged down by 1.3% in the fourth quarter of 2024, reaching a seasonally adjusted annual rate (SAAR) of $3.86 billion. This decline follows a 1.9% increase in the prior quarter. However, private fixed investment in dorms was 7.2% lower than a year ago, as the elevated interest rates place a damper on student housing construction.  

Private fixed investment in student housing experienced a surge after the Great Recession, as college enrollment increased from 17.2 million in 2006 to 20.4 million in 2011. However, during the pandemic, private fixed investment in student housing declined drastically from $4.4 billion (SAAR) in the last quarter of 2019 to $3 billion in the second quarter of 2021, as COVID-19 interrupted normal on-campus learning. According to the National Student Clearinghouse Research Center, college enrollment fell by 3.6% in the fall of 2020 and by 3.1% in the fall of 2021.  

Since then, private fixed investment has rebounded, as college enrollments show a slow but stabilizing recovery from pandemic driven declines. Effective in-person learning requires college students to return to campuses, boosting the student housing sector. Furthermore, the demand for student housing is growing robustly, because total enrollment in postsecondary institutions is projected to increase 8% from 2020 to 2030, according to the National Center for Education Statistics. 

Despite recent fluctuations, the student housing construction shows signs of recovery and is expected to grow in response to increasing student enrollment projections. 

Discover more from Eye On Housing

Subscribe to get the latest posts sent to your email.


This article was originally published by a eyeonhousing.org . Read the Original article here. .


Imagine walking into your newly built or remodeled home and seeing it exactly as you had imagined it at the start of construction: the windows are all in the right places, the flooring is the right color, and the kitchen cabinets are a perfect fit.

Now allow me to pinch you on the arm, because for most people, reality is often different from that idyllic scenario. You might see missing trim around the bedroom doors or wonder why that small change in the kitchen cost so much. Looking back, you might ask, “And why did we have to hire another subcontractor to finish the bathroom?”

Of course, there are things you just can’t plan for, but there’s plenty that you can. Costly changes and additional time-consuming work can be kept to a minimum if you fully understand what you are building before you start. By understanding the construction process, being part of the team and keeping a firm grip on the budget, your construction project can result in the home of your dreams.


This article was originally published by a www.houzz.com . Read the Original article here. .


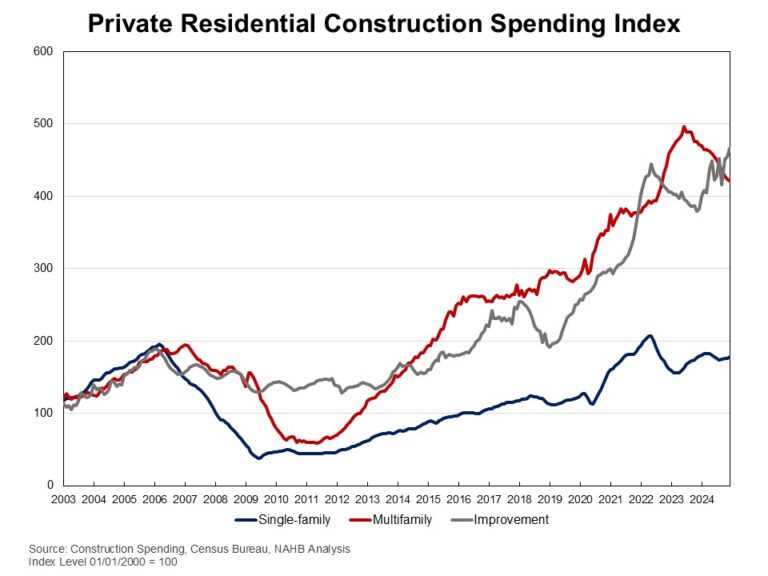
Private residential construction spending increased by 1.5% in December 2024, according to the latest U.S. Census Construction Spending data. It was the third consecutive monthly increase since September 2024.  On a year-over-year basis, the December report showed a 6% increase.

The monthly increase in total private construction spending was primarily driven by higher spending on single-family construction and residential improvements. Single-family construction spending was up 1% for the month. This marks a continuation of growth after a five-month decline from April to August, aligning with steady builder confidence seen in the Housing Market Index. However, single-family construction remained 0.8% lower than a year ago. Improvement spending rose by 2.6% in December and was 21.9% higher compared to the same period last year. In contrast, multifamily construction spending edged down 0.3% in December, following an 8.4% increase in October and a 0.8% up in November. Compared to a year ago, multifamily construction spending was still 10.5% lower.

The NAHB construction spending index is shown in the graph below. The index illustrates how   spending on single-family construction has slowed since early 2024 under the pressure of elevated interest rates. Multifamily construction spending growth has also slowed down after the peak in July 2023. Meanwhile, improvement spending has increased its pace since late 2023.

Spending on private nonresidential construction was up 2.3% over a year ago. The annual private nonresidential spending increase was mainly due to higher spending for the class of manufacturing ($23.6 billion), followed by the power category ($4.5 billion).

Discover more from Eye On Housing

Subscribe to get the latest posts sent to your email.


This article was originally published by a eyeonhousing.org . Read the Original article here. .


Real GDP of metropolitan areas rose 2.7% in 2023, with the “real estate, rental and leasing” sector contributing 0.34 percentage points and construction contracting growth by 0.11 percentage points. While many metro areas followed the national growth trend, each region has its unique economic narrative. This article explores the economic trends driving these outcomes, focusing on the leading metro areas in real GDP growth, the construction sector’s standout performers over a five-year period, and the top MSAs benefiting from growth in real estate, rental, and leasing.

In 2023, real GDP increased in 348 Metropolitan Statistical Areas (MSAs), decreased in 34 MSAs, and remained unchanged in 3 MSAs, according to the U.S. Bureau of Economic Analysis (BEA). The data, which was recently released in December 2024, shows the range of growth spanned from 42.9% in Midland, TX, to a contraction of -9.3% in Elkhart-Goshen, IN. Three MSAs—Ithaca, NY, Joplin, MO, and Longview, WA—saw no change in real GDP.

The oil and gas sector played a significant role in driving growth in many MSAs. Midland, TX, recorded the highest growth due to a surge in oil production, with the “mining, quarrying, and oil and gas extraction” industry contributing a hefty 41.2 percentage points to the metro area’s GDP growth. Furthermore, among the top five highest growth areas, four had this industry as the leading contributor.

Top Five MSAs by Real GDP Growth and Leading Contributing Industry

Metro Area2023 Real GDP Growth (%)Largest Contributing IndustryContribution (Percentage Points)Midland, TX42.9Mining, quarrying, and oil and gas extraction41.2Greeley, CO18.5Mining, quarrying, and oil and gas extraction15.5El Centro, CA16.4Agriculture, forestry, fishing, and hunting14.4Odessa, TX11.6Mining, quarrying, and oil and gas extraction7.1Wheeling, WV-OH10.7Mining, quarrying, and oil and gas extraction9.9

Construction Sector Growth (2018–2023)

From 2018 to 2023, the construction industry exhibited a mixed performance, with 140 MSAs reporting positive compound annual growth rates (CAGR), 188 recording declines, and 5 showing no change. States like Idaho, Arizona, and Florida emerged as hotspots for construction growth during this period while states in the East North Central division appear to have slowdowns in this sector.

Elizabethtown-Fort Knox, KY, led with a 14.4% CAGR in construction. This boom was primarily driven by the development of the BlueOval SK Battery Park, slated to begin production in 2025. This joint venture between Ford Motor Company and SK On, a South Korean electric vehicle (EV) supplier, is expected to be the largest EV battery manufacturing facility globally.

According to a study by the Hardin County Chamber of Commerce (HCCC), the project is estimated to:

Generate $1.6 billion in construction payroll.

Create 5,000 jobs by the end of 2025.

Require 3,100 additional housing units to accommodate new workers.

Top Five MSAs for Construction Growth (2018–2023):

Metro AreaCAGR (%)Average Contribution (Percentage Points)Elizabethtown-Fort Knox, KY14.40.45Clarksville, TN-KY10.80.03Punta Gorda, FL10.61.12Jacksonville, NC10.20.32The Villages, FL10.11.23

Real Estate, Rental, and Leasing Growth (2018–2023)

The real estate, rental, and leasing sector also showed robust growth in many regions, with 209 MSAs experiencing positive growth during the five-year period. The Villages, FL, recorded the highest CAGR at 14.1%, reflecting its status as the nation’s largest community designed for an aging population.

Other MSAs like Jonesboro, AR, saw significant real estate growth due to proximity to Arkansas State University, while Austin-Round Rock-Georgetown, TX, benefited from a population influx because of its thriving tech economy.

Top Five MSAs for Real Estate Growth (2018–2023):

Metro AreaCAGR (%)Average Contribution (Percentage Points)The Villages, FL14.13.6Jonesboro, AR12.11.2Twin Falls, ID10.81.1Austin-Round Rock-Georgetown, TX10.71.4El Centro, CA10.60.6

Visit NAHB’s dashboard for additional data and visualizations on demographics, housing market and the economy for all metro areas.

Discover more from Eye On Housing

Subscribe to get the latest posts sent to your email.


This article was originally published by a eyeonhousing.org . Read the Original article here. .


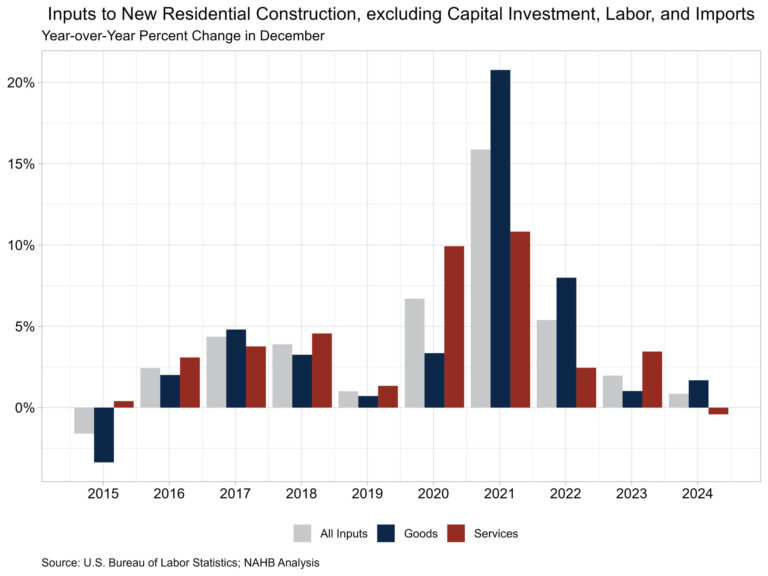
Prices for inputs to new residential construction—excluding capital investment, labor, and imports—were unchanged in December according to the most recent Producer Price Index (PPI) report published by the U.S. Bureau of Labor Statistics. This index grew 0.8% over 2024, the lowest yearly increase in the index since its inception in 2014.

The inputs to the new residential construction price index can be broken into two components—one for goods and another for services. The goods component increased 1.7% over the year, while services decreased 0.4%. For comparison, the total final demand index increased 3.3% in 2024, with final demand with respect to goods up 1.8% and final demand for services up 4.0% over the year.

Input Goods

The goods component has a larger importance to the total residential construction inputs price index, representing around 60%. The price of input goods to new residential construction was down 0.1% in December from November. The input goods to residential construction index can be further broken down into two separate components, one measuring energy inputs with the other measuring goods less energy inputs. The latter of these two components simply represents building materials used in residential construction, which makes up around 93% of the goods index.

The price of goods used in residential construction grew 1.7% in 2024, slightly higher than the growth in 2023 of 1.0%. This growth can be attributed to the rise in the prices of building materials, which grew 2.2% in 2024. The price of energy inputs fell for the second straight year, down 5.3% in 2024.

At the individual commodity level, the five commodities with the highest importance for building materials to the new residential construction index were as follows: ready-mix concrete, general millwork, paving mixtures/blocks, sheet metal products, and wood office furniture/store fixtures. Across these commodities, there was price growth for most commodities in 2024 except for sheet metal products. Ready-mix concrete was up 5.1%, wood office furniture/store fixtures up 4.3%, general millwork up 2.5%, paving mixtures/blocks up 2.3% while sheet metal products were down 0.2%. The commodity used in new residential construction the featured the highest price growth in 2024 was softwood lumber, not edge worked, which increased 14.7% in 2024. The commodity where prices declined the most was No. 2 diesel fuel, down 13.9%.

Input Services

Prices of inputs to residential construction for services were up 0.5% in December from November. The price index for service inputs to residential construction can be broken out into three separate components: a trade services component, a transportation and warehousing services component, and a services excluding trade, transportation and warehousing component. The most significant component is trade services (around 60%), followed by services less trade, transportation and warehousing (around 29%), and finally transportation and warehousing services (around 11%). The largest component, trade services, was down 1.8% in 2024 after growing 5.8% in 2023.  Across individual services, credit deposit services advanced the most in 2024, up 21.2% over the year while the prices for metal, mineral and ore wholesaling services fell the most, down 19.2%.

Discover more from Eye On Housing

Subscribe to get the latest posts sent to your email.


This article was originally published by a eyeonhousing.org . Read the Original article here. .


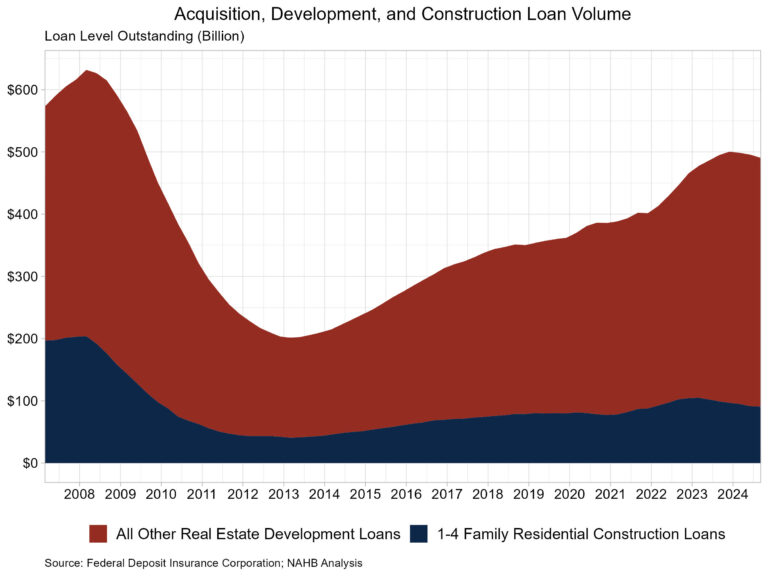
The total volume of outstanding acquisition, development, and construction (AD&C) loans made by FDIC-insured institutions fell for the third consecutive quarter during the third quarter of 2024 to a volume of $490.7 billion, down from $495.8 billion in the second quarter. Interest rates remained higher over the third quarter, as the Fed issued its first rate cut at the end of the quarter in September. Future AD&C lending conditions are poised to improve as the Fed continues its easing cycle over the next year despite potential headwinds of higher Government deficits and economic uncertainty.

The volume of 1-4 family residential construction and land development loans totaled $90.8 billion in the third quarter, down 8.4% from one year ago. This year-over-year decline marked the fifth straight quarter where the total volume of outstanding loans declined compared to a year prior. All other real estate development loans totaled $399.9 billion in the third quarter, down $4.3 billion from the previous quarter.

It is worth noting, the FDIC data represent only the stock of loans, not changes in the underlying flows, so it is an imperfect data source. Lending remains much reduced from years past. The current amount of existing 1-4 family residential AD&C loans now stands 55% lower than the peak level of residential construction lending of $204 billion reached during the first quarter of 2008. Alternative sources of financing, including equity partners, have supplemented this capital market in recent years.

While the volume of 1-4 family residential AD&C loans fell during the third quarter, the volume of past due and nonaccrual residential AD&C loans rose above $1 billion for the first time since 2014. A majority of this outstanding total was made up of loans in nonaccrual status (typically a loan where the lender does not expect to receive payment) which totaled $505.9 million. The outstanding loan balance for those 30-89 days past due was $491.5 million and loans 90 days or more past due totaled $65.4 million. As a share of the total outstanding stock of 1-4 family residential AD&C loans ($90.8 billion), past due and nonaccrual loans ($1.0 billion) made up 1.2% of the outstanding stock of loans.

Discover more from Eye On Housing

Subscribe to get the latest posts sent to your email.



This article was originally published by a eyeonhousing.org . Read the Original article here. .


After a period of slowing associated with declines for some elements of the residential construction industry, the count of open construction sector jobs has remained lower than a year ago, per the November Bureau of Labor Statistics’ Job Openings and Labor Turnover Survey (JOLTS). However, the most recent data showed a slight gain for the number of open construction sector jobs.

The number of open jobs for the overall economy increased from 7.84 million to 8.10 million in November. Nonetheless, this is notably smaller than the 8.93 million estimate reported a year ago and reflects a softened aggregate labor market. Previous NAHB analysis indicated that this number had to fall below 8 million on a sustained basis for the Federal Reserve to feel more comfortable about labor market conditions and their potential impacts on inflation. With estimates remaining below 8 million for national job openings, the Fed is continuing a policy of interest rate cuts.

The number of open construction sector jobs increased from a revised 259,000 in October to 276,000 in November. Nonetheless, the November reading of opening, unfilled construction jobs is lower than that registered a year ago (454,000) due to a slowing of construction activity because of elevated interest rates.

The construction job openings rate edged higher to 3.2% in November but remains lower than a year ago, albeit with a fair amount of statistical month-to-month noise in the recent data.

The layoff rate in construction remained in the 2% range in November (2.1%). The quits rate in construction fell to 1.7% in November.

Discover more from Eye On Housing

Subscribe to get the latest posts sent to your email.


This article was originally published by a eyeonhousing.org . Read the Original article here. .


Private residential construction spending edged up by 0.1% in November 2024, according to the latest U.S. Census Construction Spending data. Year-over-year, the November report showed a 3.1% increase.

The monthly increase in total private construction spending was primarily driven by higher spending on single-family construction and residential improvements. Single-family construction spending inched up by 0.3% for the month. This marks a continuation of growth after a five-month decline from April to August, aligning with steady builder confidence seen in the Housing Market Index. However, single-family construction remained 0.7% lower than a year ago. Improvement spending rose by 0.4% in November and was 13.4% higher compared to the same period last year. In contrast, multifamily construction spending declined by 1.3% in November, following a 0.3% increase in October. Compared to a year ago, multifamily construction spending was still 9.5% lower.

The NAHB construction spending index is shown in the graph below. The index illustrates how   spending on single-family construction has slowed since early 2024 under the pressure of elevated interest rates. Multifamily construction spending growth has also slowed down after the peak in July 2023. Meanwhile, improvement spending has increased its pace since late 2023.

Spending on private nonresidential construction was up 1.7% over a year ago. The annual private nonresidential spending increase was mainly due to higher spending for the class of manufacturing ($23.4 billion), followed by the power category ($6.1 billion).

Discover more from Eye On Housing

Subscribe to get the latest posts sent to your email.


This article was originally published by a eyeonhousing.org . Read the Original article here. .


With the end of 2024 approaching, NAHB’s Eye on Housing is reviewing the posts that attracted the most readers over the last year. In April, Natalia Siniavskaia shared wages by occupation in construction including the median salaries and top 25% salaries.

Half of payroll workers in construction earn more than $58,500 and the top 25% make at least $79,450, according to the latest May 2023 Bureau of Labor Statistics Occupational Employment and Wage Statistics (OEWS) and analysis by the National Association of Home Builders (NAHB). In comparison, the U.S. median wage is $48,060, while the top quartile (top 25%) makes at least $76,980.

The OES publishes wages for almost 400 occupations in construction. Out of these, only 46 are construction trades. The other industry workers are in finance, sales, administration and other off-site activities.

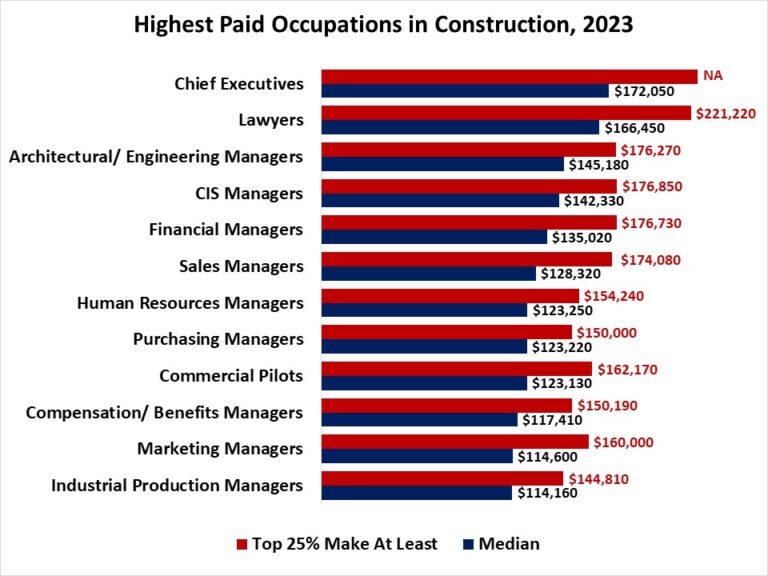
The highest paid occupation in construction is Chief Executive Officer (CEO) with half of CEOs making over $172,000 per year. Lawyers working in construction are next on the list with the median wages of $166,450, and the top 25 percent highest paid lawyers making over $221,220. Out of the next ten highest paid trades in construction, eight are various managers. The highest paid managers in construction are architectural and engineering managers, with half of them making over $145,180 and the top 25 percent on the pay scale earning over $176,270 annually.

Among construction trades, elevator installers and repairers top the median wages list with half of them earning over $103,340 a year, and the top 25% making at least $129,090. First-line supervisors of construction trades are next on the list; their median wages are $76,960, with the top 25% highest paid supervisors earning more than $97,500.

In general, construction trades that require more years of formal education, specialized training or licensing tend to offer higher annual wages. Median wages of construction and building inspectors are $65,790 and the wages in the top quartile of the pay scale exceed $88,800. Half of plumbers in construction earn over $61,380, with the top quartile making over $80,300. Electricians’ wages are similarly high.

Carpenters are one of the most prevalent construction crafts in the industry. The trade requires less formal education. Nevertheless, the median wages of carpenters working in construction exceed the national median. Half of these craftsmen earn over $57,300 and the highest paid 25% bring in at least $73,800.

The OEWS program adopted a new estimation methodology in 2021. As a result, the previously published estimates are not directly comparable to the post-pandemic editions.  Nevertheless, comparing the median wages in construction over the last two years reveals that, on average, lower-paid occupations experienced a somewhat faster wage growth. Median wages of drywall installers, for example, grew 11%. Moreover, the overall construction median increased 7.3%, one of the largest increases among all industries.  

Discover more from Eye On Housing

Subscribe to get the latest posts sent to your email.


This article was originally published by a eyeonhousing.org . Read the Original article here. .

Pin It