Tag

construction statistics

Browsing


The share of new single-family homes built in the 1,600-3,000 square-foot range closely matches the share of buyers who want homes of that size, according to recent surveys from NAHB and the U.S. Census Bureau. The surveys show that 21% of buyers want homes with 1,600 to 1,999 square feet, and 22% of new single-family homes started in 2023 have that much floor space. In the next tier up, 38% of buyers want homes with 2,000 to 2,999 square feet, and 40% of new single-family homes fall within that size range.

Results on the square footage buyers want in their next home were published in the 2024 edition of What Home Buyers Really Want, based on a representative sample of 3,008 recent and prospective home buyers conducted in 2023. The size of homes started comes from NAHB tabulation of the recently released 2023 data file from the Census Bureau’s Survey of Construction.

Outside of the 1,600-3,000 square-foot range, the match between what buyers want and what builders provide is not as close. While 26% of buyers want homes under 1,600 square feet, only 16% of single-family homes started in 2023 were that small. And while 22% of new homes have at least 3,000 square feet, only 14% of buyers are looking for homes that large.

Part of the reason for the apparent mismatch, of course, is that builders are compensating for the existing stock of housing, much of which was built decades ago when homes tended to be smaller. According to the latest American Housing Survey (funded by HUD and conducted in odd-numbered years by the Census Bureau), a full one-third of existing homes in the U.S. have less than 1,500 square feet of floor space. Moreover, the median size of an existing single-family detached home is 1,800 square feet, compared to 2,200 square feet for single-family homes started in 2023 and the 2,067 square feet that home buyers say they want in the NAHB survey.

In other words, the median buyer wants a home that is 133 square feet smaller than the median new single-family home, but still 267 square feet larger than the median existing single-family detached home.

Discover more from Eye On Housing

Subscribe to get the latest posts sent to your email.


This article was originally published by a eyeonhousing.org . Read the Original article here. .

Almost all new single-family homes that started construction in 2023 used either an air/ground source heat pump or a forced air system (without heat pump) for the primary heating system (98% in 2023), according to the Census’s Survey of Construction.  While this survey data does not separate the air source heat pump systems and ground heat pump systems (geothermals), another study discusses their usage in green building. Additionally, 17% of homes used a secondary type of heating equipment. 

Heating Systems

The type of heating system installed varies significantly by Census Division. In warmer regions of the country, air/ground source systems are more common with an 81% share in the South Atlantic and a 72% share in the East South Central. In colder regions, very few homes have air or ground-source heat pumps: only 7% of new homes started in New England and only 8% in East North Central. Forced air systems without heat pumps burn fuel to produce heat, while heat pumps transfer heat by moving air. Therefore, in extreme climates (below freezing), heat pumps can become less efficient due to the limited ambient heat available.

In general, the share of new homes using an air or ground-source heat pump as the primary means of providing heat has increased, going from 23% in 2000 to 45% in 2023. Meanwhile, the share relying on a forced air system without heat pumps has slipped, going from 71% to 53% in the same time frame.

Primary Fuel for Heating

The SOC also provides data on the primary fuel used to heat new single-family homes. Approximately 54% of new homes started in 2023 use electricity as the primary heating fuel, compared to 43% powered by natural gas, 3% using bottle or liquified petroleum gas (propane), and 0.1% using oil.

Heating fuel sources closely align with the types of heating systems used, with air and ground-source heat pumps running on electricity and most forced air systems without heat pumps using natural gas or propane. Consequently, the primary heating fuel source differs significantly by region across the country. For example, in New England only 10% of new homes used electricity as the primary heating source. In contrast, 83% of new homes started in the South Atlantic use it. Additionally, while most regions fall under 10% in their usage of propane, New England had a 29% share and East North Central had 11%.

Air Conditioning

In 2023, 98% of new single-family homes started had a central AC system, rising from 97.1% in 2022. This percentage has risen steadily since 2000 when only 85.5% of homes had a central AC system.

Though the share of new single-family homes started with central AC differs across the country’s nine Census divisions, the highest share is concentrated in the South region: 100% of homes started in the South Atlantic, East South Central, and West South Central divisions had central AC installed. Closely falling behind were the West North Central and Pacific Divisions, both at 98%. Trailing last were the Middle Atlantic (95%), East North Central (94%), Mountain (93%), and New England (89%) divisions.

Discover more from Eye On Housing

Subscribe to get the latest posts sent to your email.


This article was originally published by a eyeonhousing.org . Read the Original article here. .

Private residential construction spending was down 0.3% in June, after a dip of 0.7% in the prior month, according to the Census Construction Spending data. Nevertheless, it remained 7.3% higher compared to a year ago.

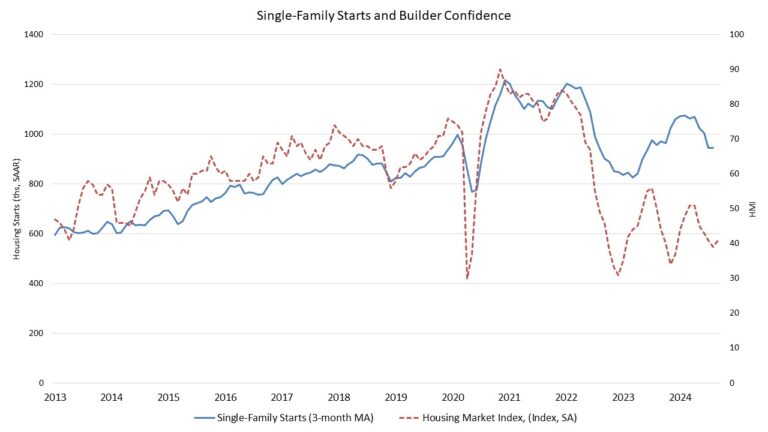
The monthly decline in total private construction spending for June was largely due to reduced spending on single-family construction. Spending on single-family construction fell by 1.2% in June, following a dip of 0.6% in May. This marks the third consecutive monthly decrease. Elevated mortgage interest rates have cooled the housing market, dampening home builder confidence and new home starts. Despite this, spending on single-family construction was still 9.9% higher than it was a year earlier.

Multifamily construction spending inched up 0.1% in June after a dip of 0.6% in May. Year-over-year, spending on multifamily construction declined 7.4%, as an elevated level of apartments under construction is being completed. Private residential improvement spending increased 0.6% in June and was 10.4% higher compared to a year ago.

The NAHB construction spending index is shown in the graph below (the base is January 2000). The index illustrates how spending on single-family construction and home improvements have slowed down the pace since early 2024 under the pressure of elevated interest rates. Multifamily construction spending growth slowed down after the peak in June 2023.

Spending on private nonresidential construction was up 4.2% over a year ago. The annual private nonresidential spending increase was mainly due to higher spending for the class of manufacturing ($37.6 billion), followed by the power category ($13 billion).

Discover more from Eye On Housing

Subscribe to get the latest posts sent to your email.


This article was originally published by a eyeonhousing.org . Read the Original article here. .

Nationwide, the share of non-conventional financing for new home sales accounted for 32.4% of the market per NAHB analysis of the 2023 Census Bureau Survey of Construction (SOC) data. This is a significant 4.3 percentage point increase from the 2022 share of 28.1%. As in previous years, conventional financing dominated the market at 67.6% of sales, albeit lower than the 2022 share of 71.9%.

Non-conventional forms of financing, as opposed to conventional mortgage loans, include loans insured by the Federal Housing Administration (FHA), VA-backed loans, cash purchases and other types of financing such as the Rural Housing Service, Habitat for Humanity, loans from individuals, or state or local government mortgage-backed bonds. The reliance on non-conventional forms of financing varied across the United States, with its share at almost 40% in West South Central but only 17.1% of new single-family home starts in the Middle Atlantic division.

Nationwide, cash purchases were the majority share of non-conventional financing of new home purchases, accounting for 14% of the market share, slightly up from 13% in 2022. NAHB survey based on builders reported that for 2024, all-cash sales are a higher share at 22%. FHA-backed loans accounted for 12%, whereas in 2022, it was only 8% of the market share. The share of VA-backed loans was at 4% market share in 2023, while Other Financing was 3% of market share.

Regionally, cash financing held the highest share in East South Central, where 24.6% of all homes started were purchased with cash. Except for the South Atlantic, West South Central, and the Pacific, cash purchases led non-conventional financing in the remaining six census regions. Cash purchases accounted for 22.0% in East North Central, 16.9% in New England, 12.3% in Mountain, 12.0% in Middle Atlantic, and 10.6% in West North Central region.   

FHA-backed loans accounted for the majority of all non-conventional financing in the West South Central division accounting for 20.8% of the homes started. This share has gone up considerably  from 12.9% in 2022. The New England division reported the lowest FHA-backed loans with only a share of 1.2% of the homes started in 2023.

VA-backed loans were most used in the South Atlantic division, which accounted for 5.9% of non-conventional forms of financing. In New England, none of the homes started used VA-backed loans in 2023.  

Other financing such as the Rural Housing Service, Habitat for Humanity, loans from individuals, state or local government mortgage-backed bonds was highest in East North Central where it was collectively 5.6% of market share, while Middle Atlantic division reported the lowest share at 0.9%.

Discover more from Eye On Housing

Subscribe to get the latest posts sent to your email.


This article was originally published by a eyeonhousing.org . Read the Original article here. .
Pin It