Tag

construction statistics

Browsing


The average completion time of a single-family house in 2023 was approximately 10.1 months, breaking down to 1.5 months for authorization to start construction and another 8.6 months to finish construction. According to the Census Bureau’s Survey of Construction, the permit-to-completion time has been on an upward trend since 2015. Currently, it is almost 3 months longer than the average completion time in 2015. This extended duration is largely attributable to a more stringent regulatory environment, ongoing supply-chain challenges and a shortage of skilled labor.

Among all single-family houses completed in 2023, homes built for sale required the shortest amount of time, 8.9 months from obtaining building permits to completion. Meanwhile, homes built by owners (custom builds) required the longest time, 15.2 months. Homes built by hired contractors tookabout12.1 months, and homes built-for-rent took about 12.2 months from authorization to completion.

The time from permit to start for all types of homes was longer in 2023. The period of time necessary to start construction required, on average, 1.5 months in 2023. In contrast, prior to 2017 construction typically started within the same month after obtaining building authorization. Between authorization and the start of construction, built for sale and built by contractors on owner’s land required 1.5 months and 1.4 months respectively. The permit-to-start time was even longer for homes built-for-rent and custom builds (1.6 months).

The chart below illustrates that permit-to-completion time differs across home sizes. The smallest single-family homes, under 1,200 sq. ft., required 13 months to finish, relatively longer than larger homes under 5,000 sq. ft. This prolonged period is primarily because half of these smaller homes are constructed specifically for rental purposes, which typically takes longer building time from authorization. In contrast, homes ranging from 1,200 to 3,999 sq. ft. are built at the average building time, typically around 10 months. As the size increases beyond 4,000 sq. ft., there is a noticeable upward trend in completion times. Homes with 4,000-4,999 sq. ft. take about 12 months, while those between 5,000- 5,999 sq. ft. extend to a little more than 14 months. Homes over 6,000 sq. ft. take the longest to build, requiring almost 18 months from permit to finish.

The average time from authorization to completion also varies across divisions. The division with the longest duration was New England (13.9 months), followed by the Middle Atlantic (13.2 months), the Mountain division (11.4 months), and the Pacific division (11.2 months) in 2023. These four divisions exceeded the nation’s average of10.1 months. The shortest period, 8.9 months, is registered in the South Atlantic division. The average waiting period from permit to construction start varies from the shortest time of 0.9 months in the East North Central to the longest of 2 months in New England.

The SOC also collects additional information for houses built for sale, including a sale date when buyers sign sale contracts or make a deposit. Looking at single-family homes built for sale and completed in 2023, 17.2% were sold before construction started, 41.8% sold while under construction, 15.6% sold during the month of completion, and 19.7% sold after completion. The share of completed houses remaining unsold was 5.8% at point of survey.

Discover more from Eye On Housing

Subscribe to get the latest posts sent to your email.


This article was originally published by a eyeonhousing.org . Read the Original article here. .

A majority of single-family homes started in 2023 continued to have two full bathrooms according to the latest release of the Census Bureau’s Survey of Construction.  According to the latest data, 64.7% of new single-family homes started in 2023 had two full bathrooms, 23.8% had three full bathrooms, 6.9% had 4 or more full bathrooms, and only 4.6% had one full bathroom or less.

The recent data features the largest increase since 2018 in single-family homes with two bathrooms, as the share increased from 62.3% to 64.7%. This reverses the trend of the past two years when this share consecutively decreased. The share of single-family starts with 3 full bathrooms fell for the second straight year, down to 23.8%, while the share of single-family starts with 1 full bathroom or less rose to 4.6%, the third straight increase. Single-family homes started with 4 or more bathrooms share decreased to 6.9%, after increasing the prior two years.

Across the U.S., the New England census division had the highest share at 75.6% of new single-family starts having two full bathrooms. This share jumped by 22.2 percentage points from 2022, and this was the first time since 2017 that the New England share was the largest in the nation. The lowest share census division was the Middle Atlantic, with 50.0% of new single-family starts reporting two full bathrooms. The share of new single-family started with two full bathrooms fell 9.2 percentage points from 2022 in the Middle Atlantic.

Half-Bathrooms

Most new single-family homes started in 2023 have no half-bathrooms at 54.7%. Following closely is the share of new single-family homes with one half-bathroom at 43.8% . New single-family starts with two or more half-bathrooms had a small share of 1.5% in 2023.

Half-bathrooms are historically prevalent in the New England census division as 79.8% of new single-family starts had at least one in 2023. Half-bathrooms were the least common in the West South Central, with only 38.3% of new single-family starts reporting at least one half-bathroom. A trend of note is in the Pacific, where the share has fallen for five consecutive years, from 53.2% in 2018 to 40.7% in 2023.

Discover more from Eye On Housing

Subscribe to get the latest posts sent to your email.


This article was originally published by a eyeonhousing.org . Read the Original article here. .

The share of new homes with patios increased to yet another record high in 2023. Of the roughly 950,000 single-family homes started during the year, 63.7% came with patios. This is up from 63.3% in 2022 and marks the eighth consecutive year the percentage set a new record high. The source for these numbers is NAHB tabulation of data from the Survey of Construction (conducted by the U.S. Census Bureau with partial funding from the Department of Housing and Urban Development).

Historically, fewer than half of new homes came with patios during the 2008-2011 period of extreme weakness in housing markets. But soon thereafter, the share jumped to 52.4% in 2012 and has been climbing ever since. The percentage has now increased in thirteen of the past fourteen years. The only exception was 2015, when the percentage was unchanged.

While patios for new homes have generally become more common over time, the parts of the country where they tend to be most common have remained consistent. At the low end, only 17% percent of new single-family homes built in New England and 20% in the Middle Atlantic came with patios in 2023. At the high end, the incidence of patios on new homes was over 80% in the West South Central and close to 70% in the South Atlantic and Mountain divisions. The geographic tendencies are similar to the ones reported in last year’s post.

Additional detail on the characteristics of new-home patios is available from the Annual Builder Practices Survey (BPS) conducted by Home Innovation Research Labs.

For the U.S. as a whole, the 2024 BPS report (based on homes built in 2023, like the SOC-based statistics cited above) shows that the average size of a new-home patio is about 290 square feet, but with considerable geographic variation. The average is over 400 square feet in the East South Central and about 380 square feet in New England; but under 200 square feet in the West South Central, and only a little over 200 square feet in the adjacent West North Central division.

In most parts of the country, poured concrete dominates all other building materials used in new-home patios. In the East South Central, for instance, poured concrete accounts for over 90% of new-home patios on a square-foot basis. To the extent that there are exceptions, they occur on the east coast. In the South Atlantic, concrete and brick pavers each have about a quarter of the market, and poured concrete has less than half. In New England, the market is more or less equally divided among poured concrete, concrete pavers and natural stone. In the Mid-Atlantic, brick pavers are the most popular choice for new-home patios by a substantial margin.

Discover more from Eye On Housing

Subscribe to get the latest posts sent to your email.


This article was originally published by a eyeonhousing.org . Read the Original article here. .

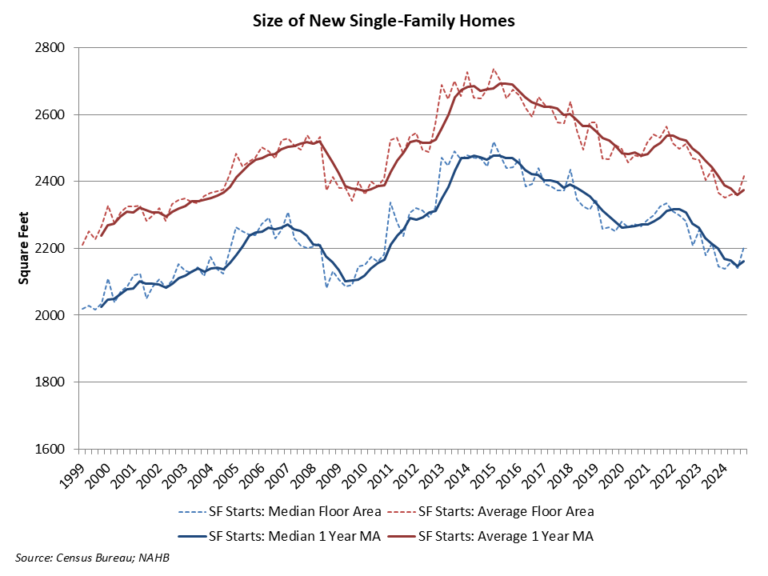
An expected impact of the virus crisis was a need for more residential space, as people use homes for more purposes including work. Home size correspondingly increased in 2021 as interest rates reached historic lows. However, as interest rates increased in 2022 and 2023, and housing affordability worsened, the demand for home size has trended lower.

According to second quarter 2024 data from the Census Quarterly Starts and Completions by Purpose and Design and NAHB analysis, median single-family square floor area edged up to 2,164 square feet, just off the lowest reading since the second half of 2009. Average (mean) square footage for new single-family homes registered at 2,363 square feet.

Since Great Recession lows (and on a one-year moving average basis), the average size of a new single-family home is now effectively flat at 2,387 square feet, while the median size is about 3% higher at 2,165 square feet.

Home size rose from 2009 to 2015 as entry-level new construction lost market share. Home size declined between 2016 and 2020 as more starter homes were developed. After a brief increase during the post-COVID building boom, home size trended lower due to declining affordability conditions. As interest rates decline, new home size could level off and increase in the quarters ahead.

Discover more from Eye On Housing

Subscribe to get the latest posts sent to your email.


This article was originally published by a eyeonhousing.org . Read the Original article here. .

Single-family built-for-rent construction posted year-over-year gains as of the second quarter of 2024, as builders sought to add additional rental housing in a market facing ongoing, elevated mortgage interest rates.

According to NAHB’s analysis of data from the Census Bureau’s Quarterly Starts and Completions by Purpose and Design, there were approximately 23,000 single-family built-for-rent (SFBFR) starts during the second quarter of 2024. This is almost 10% higher than the second quarter of 2023. Over the last four quarters, 83,000 such homes began construction, which is a more than 20% increase compared to the 69,000 estimated SFBFR starts in the four quarters prior to that period.

The SFBFR market is a source of inventory amid challenges over housing affordability and downpayment requirements in the for-sale market, particularly during a period when a growing number of people want more space and a single-family structure. Single-family built-for-rent construction differs in terms of structural characteristics compared to other newly-built single-family homes, particularly with respect to home size. However, investor demand for single-family homes, both existing and new, has cooled with higher interest rates. Nonetheless, builders continue to build projects of built-for-rent homes for their own operation.

Given the relatively small size of this market segment, the quarter-to-quarter movements typically are not statistically significant. The current four-quarter moving average of market share (8%) is nonetheless higher than the historical average of 2.7% (1992-2012).

Importantly, as measured for this analysis, the estimates noted above include only homes built and held by the builder for rental purposes. The estimates exclude homes that are sold to another party for rental purposes, which NAHB estimates may represent another three to five percent of single-family starts based on industry surveys.

The Census data notes an elevated share of single-family homes built as condos (non-fee simple), with this share averaging more than 3% over recent quarters. Some, but certainly not all, of these homes will be used for rental purposes. Additionally, it is theoretically possible some single-family built-for-rent units are being counted in multifamily starts, as a form of “horizontal multifamily,” given these units are often built on a single plat of land. However, spot checks by NAHB with permitting offices indicate no evidence of this data issue occurring.

Nonetheless, demand by investors for single-family rental units, new and existing, has cooled in recent quarters as financial conditions remain tight. This will continue to cool some investor demand for SFBFR housing.

With the onset of the Great Recession and declines for the homeownership rate, the share of built-for-rent homes increased in the years after the recession. While the market share of SFBFR homes is small, it has clearly expanded. Given affordability challenges in the for-sale market, the SFBFR market will likely retain an elevated market share even as the sector cools in the quarters ahead.

Discover more from Eye On Housing

Subscribe to get the latest posts sent to your email.


This article was originally published by a eyeonhousing.org . Read the Original article here. .

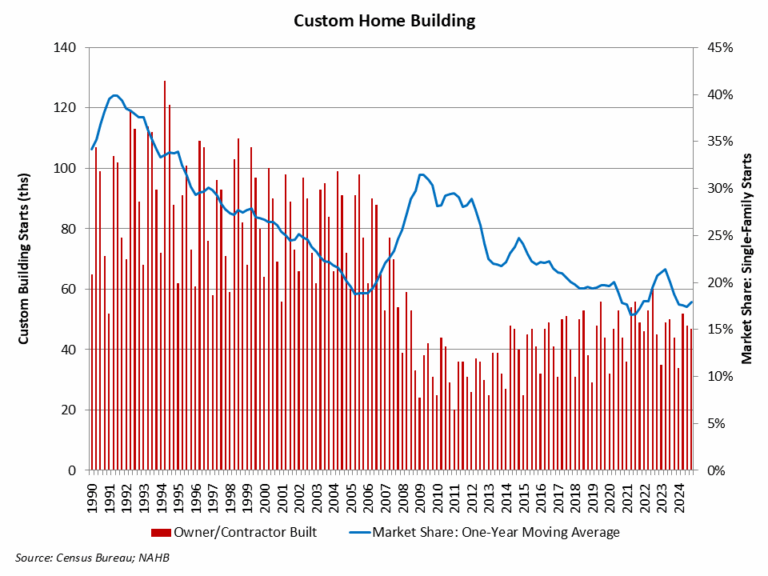
NAHB’s analysis of Census Data from the Quarterly Starts and Completions by Purpose and Design survey indicates gains for custom home building after some recent slowing. Custom home building typically involves home buyers less sensitive to changes for interest rates.

There were 52,000 total custom building starts during the second quarter of 2024. This marks an almost 6% increase compared to the second quarter of 2023 and the best reading since the third quarter of 2022. Over the last four quarters, custom housing starts totaled 180,000 homes, a 5% decline compared to the prior four quarter total (189,000) due to weakness in prior quarters.

After share declines due to a rise in spec building in the wake of the pandemic, the market share for custom homes increased until 2023 and then entered a period of retrenchment. As measured on a one-year moving average, the market share of custom home building, in terms of total single-family starts, has fallen back to just under 18%. This is down from a prior cycle peak of 31.5% set during the second quarter of 2009 and a 21% local peak rate at the beginning of 2023.

Note that this definition of custom home building does not include homes intended for sale, so the analysis in this post uses a narrow definition of the sector. It represents home construction undertaken on a contract basis for which the builder does not hold tax basis in the structure during construction.

Discover more from Eye On Housing

Subscribe to get the latest posts sent to your email.


This article was originally published by a eyeonhousing.org . Read the Original article here. .

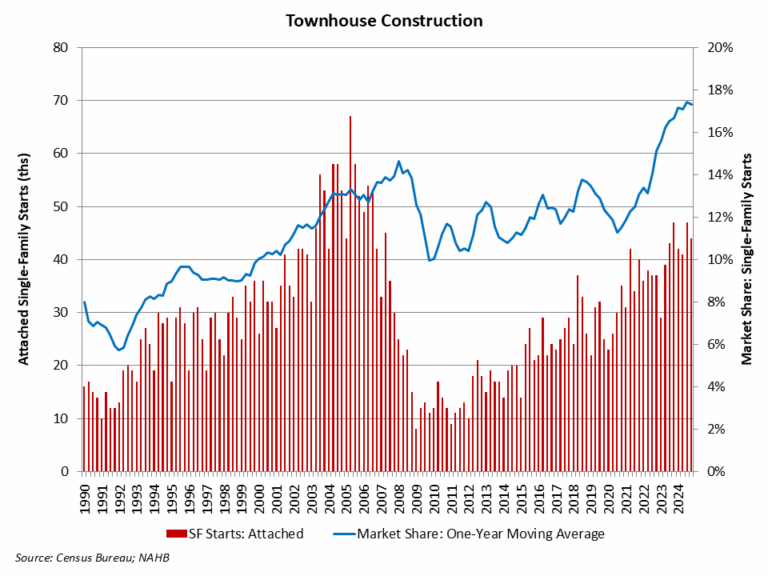
Year-over-year gains for townhouse construction continued during the second quarter 2024 as demand for medium-density housing continues to be solid despite slowing for other sectors of the building industry.

According to NAHB analysis of the most recent Census data of Starts and Completions by Purpose and Design, during the second quarter of 2024, single-family attached starts totaled 42,000, which is 8% higher than the second quarter of 2023. Over the last four quarters, townhouse construction starts totaled a strong 174,000 homes, which is 23% higher than the prior four-quarter period (142,000). Townhouses made up almost 15% of single-family housing starts for the second quarter of the year.

Using a one-year moving average, the market share of newly-built townhouses stood at 17.2% of all single-family starts for the second quarter. With recent gains, the four-quarter moving average market share remain at the highest on record, for data going back to 1985.

Prior to the current cycle, the peak market share of the last two decades for townhouse construction was set during the first quarter of 2008, when the percentage reached 14.6%, on a one-year moving average basis. This high point was set after a fairly consistent increase in the share beginning in the early 1990s.

The long-run prospects for townhouse construction are positive given growing numbers of homebuyers looking for medium-density residential neighborhoods, such as urban villages that offer walkable environments and other amenities. Where it can be zoned, it can be built.

Discover more from Eye On Housing

Subscribe to get the latest posts sent to your email.


This article was originally published by a eyeonhousing.org . Read the Original article here. .

Of the roughly 950,000 single-family and 470,000 multifamily homes that started construction in 2023, 49,000 (30,000 single-family and 19,000 multifamily) were built in age-restricted communities, according to NAHB tabulation of data from the Census’s Survey of Construction. A residential community can be legally age-restricted, provided it conforms to one of the set of rules specified in the Housing for Older Persons Act of 1995. 

NAHB was first successful in persuading HUD and the Census Bureau to collect and publish data on the age-restricted status of new homes in 2009, during the depths of the housing downturn. In 2009, builders started only 17,000 homes in age-restricted communities (9,000 single-family and 8,000 multifamily).  The numbers then increased steadily until reaching 60,000 age-restricted starts (roughly evenly split between single-family and multifamily) in 2018. These numbers fell during the pandemic but rebounded in 2021-2022, almost reaching the peak from 2018.  

In 2023, the total number of age-restricted home starts decreased by approximately 17% from 2022, down to 49,000. Overall, housing starts were lower than the previous year, with single-family and multifamily starts dropping by about 6% and 14%, respectively. However, age-restricted home starts showed a mixed trend: they increased for single-family homes but declined for multifamily homes. This shift was due to a higher percentage of single-family home starts being age-restricted compared to the previous year, while a lower percentage of multi-family home starts fell into this category. 

The SOC data allow for a comparison of the characteristics of new age-restricted single-family homes with other single-family homes started in 2023. The analysis reveals that age-restricted homes were more expensive, with a median price of $500,000, compared to $422,000 for non-age-restricted homes. This follows a similar tendency observed in 2022, when age-restricted homes had a median price of $547,000, compared to $461,000 for non-age-restricted homes.

However, in 2022, the median size was the same for both types of homes, making age-restricted homes more expensive per square foot. In 2023, on the other hand, the median size was 200 square feet larger for age-restricted homes, resulting in the same median price per square foot for both types of homes at $152.63. A difference was also apparent in lot value. Although the median lot size was the same for age-restricted and non-age-restricted lots (0.2 acres), the median value for age-restricted lots was $50,000 compared to $60,000 for non-age-restricted lots.

Additional data from the 2023 SOC reveal that age-restricted homes have distinct characteristics compared to non-age-restricted homes. A higher percentage of age-restricted homes are attached, single-story, and lack a basement. These homes are also more likely to come with patios and porches, but less likely to have decks.  Finally, age-restricted homes are less likely to require a loan and more likely to be purchased for cash, as home buyers who are older have had more of a chance to accumulate the savings and assets (often equity in a previous home) that can be converted to cash.

Discover more from Eye On Housing

Subscribe to get the latest posts sent to your email.


This article was originally published by a eyeonhousing.org . Read the Original article here. .

Over the first half of 2024, the total number of single-family permits issued year-to-date (YTD) nationwide reached 514,728. On a year-over-year (YoY) basis, this is an increase of 14.6% over the June 2023 level of 449,226.

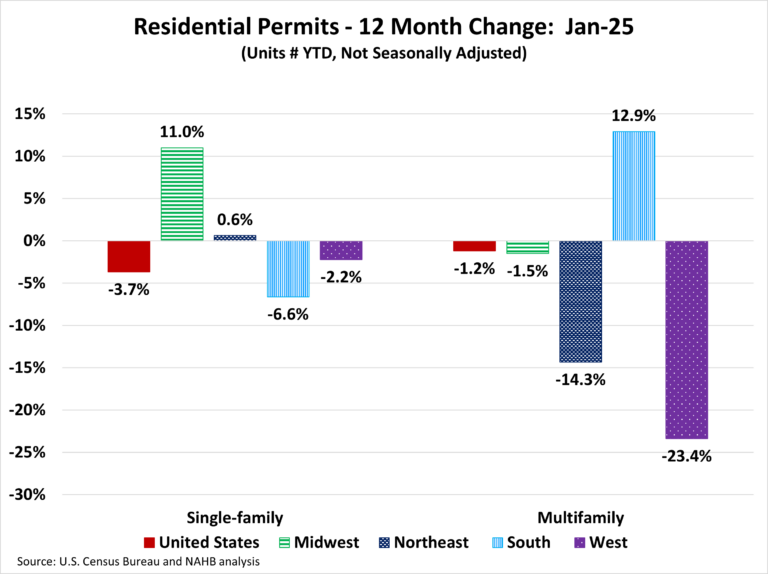
Year-to-date ending in June, single-family permits were up in all four regions. The range of permit increases spanned 19.9% in the West to 8.2% in the Northeast. The Midwest was up by 15.8% and the South was up by 13.2% in single-family permits during this time. For multifamily permits, three out of the four regions posted declines. The Northeast, the only region to post an increase, was up by 29.7%. Meanwhile the West posted a decline of 32.0%, the South declined by 24.4%, and the Midwest declined by 12.5%.

Between June 2024 YTD and June 2023 YTD, 47 states posted an increase in single-family permits. The range of increases spanned 44.3% in Arizona to 3.0% in Alaska. Rhode Island (-0.3%), New Hampshire (-1.3%), Hawaii (-6.8%), and the District of Columbia (-9.0%) reported declines in single-family permits.The ten states issuing the highest number of single-family permits combined accounted for 64.2% of the total single-family permits issued. Texas, the state with the highest number of single-family permits, issued 84,920 permits over the first half of 2024, which is an increase of 18.2% compared to the same period last year. The succeeding highest state, Florida, was up by 9.2%, while the third highest, North Carolina, posted an increase of 10.6%.

Year-to-date ending in June, the total number of multifamily permits issued nationwide reached 237,935. This is 18.9% below the June 2023 level of 293,301.

Between June 2024 YTD and June 2023 YTD, 19 states recorded growth in multifamily permits, while 31 states and the District of Columbia recorded a decline. New York (+109.8%) led the way with a sharp rise in multifamily permits from 8,943 to 18,761, while the District of Columbia had the biggest decline of 71.0% from 1,677 to 487. The ten states issuing the highest number of multifamily permits combined accounted for 64.3% of the multifamily permits issued. Over the first half of 2024, Texas, the state with the highest number of multifamily permits issued, experienced a decline of 35.2%. Following closely, the second-highest state in multifamily permits, Florida, saw a decline of 24.1%. California, the third largest multifamily issuing state, decreased by 29.8%.

At the local level, below are the top ten metro areas that issued the highest number of single-family permits.

For multifamily permits, below are the top ten local areas that issued the highest number of permits.

Discover more from Eye On Housing

Subscribe to get the latest posts sent to your email.


This article was originally published by a eyeonhousing.org . Read the Original article here. .


Wood framing remains the most dominant construction method for completed single-family homes in the U.S., according to NAHB analysis of 2023 Census Bureau data. For 2023 completions, 93% of new homes were wood-framed, another 7% were concrete-framed homes, and less than half a percent were steel-framed.

On a count basis, there were 930,000 wood-framed homes completed in 2023. This was a 3% decrease compared to the 2022 total. The wood-framed market share decreased to 93% in 2023, after it increased for three consecutive years, from 2019 (90%) to 2022 (94%). As noted above, steel-framed homes are relatively uncommon, with 3,000 housing completions in 2023, the same amount as the 2021 and 2022 completions.

Meanwhile, the concrete-framed market share increased from 6% in 2022 to 7% in 2023. On a count basis, there were 65,000 concrete-framed homes completed in 2023, up 3% from the previous year. This is the first increase after three straight years of declines (down 13% in 2020, 5% in 2021 and 11% in 2022).

Non-wood based framing methods are primarily concentrated in the South due to residential resiliency requirements. In 2023, concrete-framed homes made up 11% of all homes completed in the South. Additionally, approximately two-thirds of steel-framed homes completed in 2023 were in the South.

Discover more from Eye On Housing

Subscribe to get the latest posts sent to your email.


This article was originally published by a eyeonhousing.org . Read the Original article here. .
Pin It