Tag

construction statistics

Browsing


Private residential construction spending increased by 1.3% in February, rebounding from a 1.2% dip in January. The growth was largely driven by higher spending on single-family construction and residential improvements. On a year-over-year basis, the February report showed a 1.6% gain, indicating a modest growth in private residential construction spending during market uncertainties. 

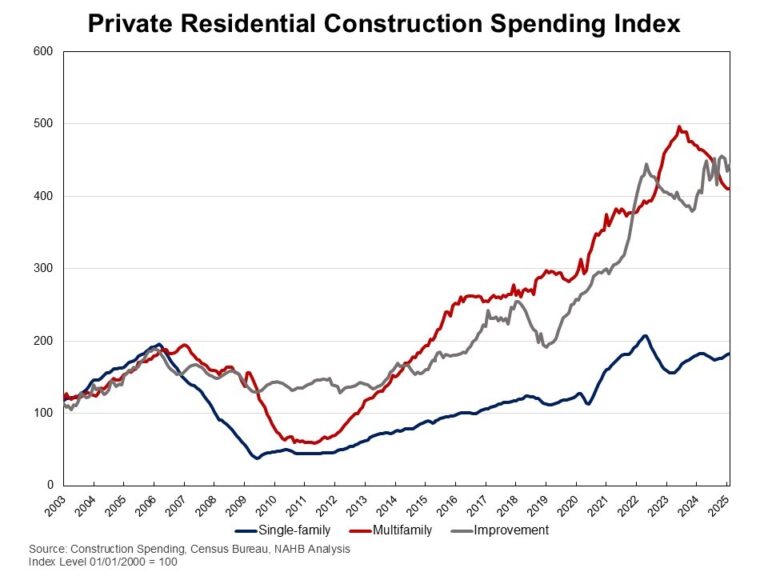
The monthly increase in total private construction spending was primarily driven by gains in spending on single-family construction and residential improvements. Single-family construction spending was up 1% for the month, continuing to grow after a five-month decline from April to August 2024. This growth is consistent with strong single-family housing starts in February. However, single-family construction spending remained 0.1% lower than a year ago. Meanwhile, improvement spending rose by 2% in February and was 8.9% higher compared to the same period last year. In contrast, multifamily construction spending stayed flat in February, extending the downward trend that began in December 2023. Compared to a year ago, multifamily construction spending was down 11.6%. 

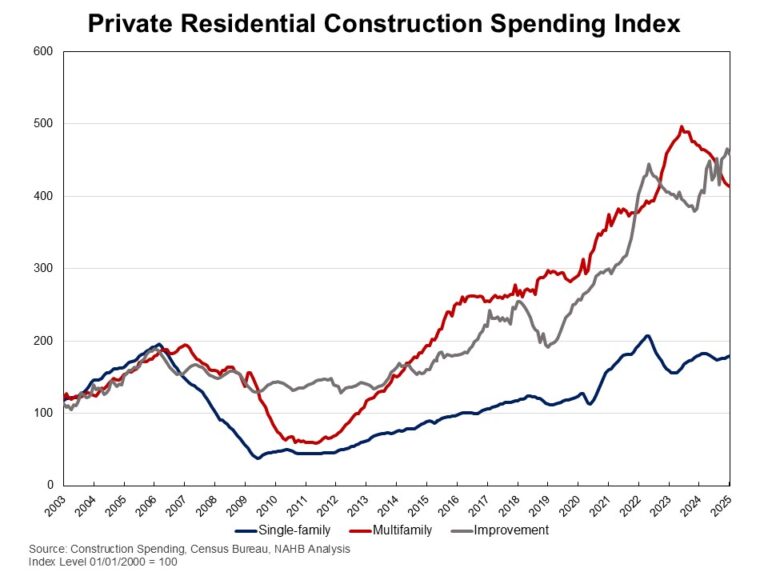
The NAHB construction spending index is shown in the graph below. The index illustrates how   spending on single-family construction has slowed since early 2024 under the pressure of elevated interest rates and concerns over building material tariffs. Multifamily construction spending growth has also slowed down after the peak in July 2023. Meanwhile, improvement spending has increased its pace since late 2023.  

Spending on private nonresidential construction was up 2.5% over a year ago. The annual private nonresidential spending increase was mainly due to higher spending for the class of manufacturing ($10.5 billion), followed by the power category ($6.4 billion). 

Discover more from Eye On Housing

Subscribe to get the latest posts sent to your email.


This article was originally published by a eyeonhousing.org . Read the Original article here. .
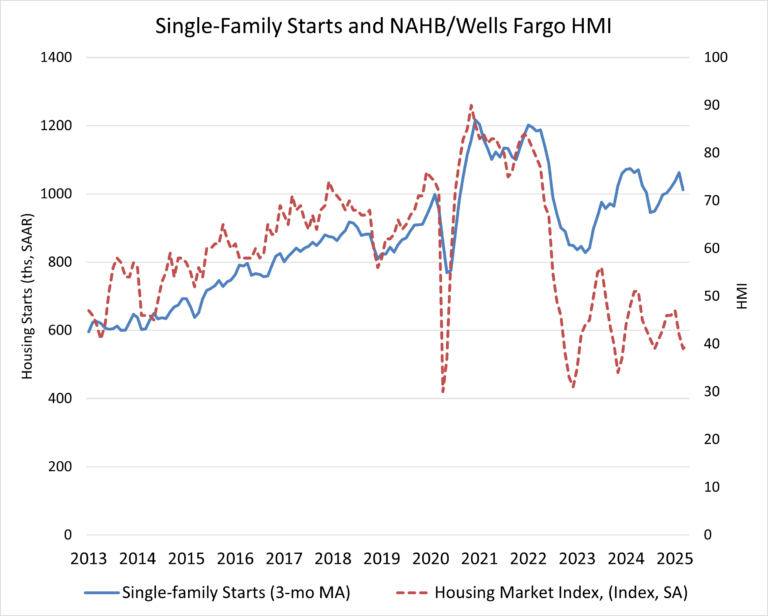

Limited existing inventory helped single-family starts to post a solid gain in February, but builders are still grappling with elevated construction costs stemming from tariff issues and persistent shortages related to buildable lots and labor.

Overall housing starts increased 11.2% in February to a seasonally adjusted annual rate of 1.50 million units, according to a report from the U.S. Department of Housing and Urban Development and the U.S. Census Bureau. The February reading of 1.50 million starts is the number of housing units builders would begin if development kept this pace for the next 12 months.

Within this overall number, single-family starts increased 11.4% to a 1.11 million seasonally adjusted annual rate, the highest pace since February 2024. The multifamily sector, which includes apartment buildings and condos, increased 10.7% to an annualized 393,000 pace.

While solid demand and a lack of existing inventory provided a boost to single-family production in February, our latest builder survey shows that builders remain concerned about challenging housing affordability conditions, most notably elevated financing and construction costs as well as tariffs on key building materials.

On a regional and year-to-date basis, combined single-family and multifamily starts were 4.7% lower in the Northeast, 21.5% lower in the Midwest, 8.3% lower in the South and 20.2% higher in the West.

Overall permits decreased 1.2% to a 1.46-million-unit annualized rate in February and were down 6.8% compared to February 2024. Single-family permits decreased 0.2% to a 992,000-unit rate and were down 3.4% compared to the previous year. Multifamily permits decreased 3.1% to a 464,000 pace.

Looking at regional permit data on a year-to-date basis, permits were 30.1% lower in the Northeast, 2.3% higher in the Midwest, 2.1% lower in the South and 12.5% lower in the West.

The number of single-family homes under construction in February was down 6.7% from a year ago, at 640,000 homes. In February, the count of apartments under construction increased 0.3% to an annualized 772,000 pace. It marks the first gain after 18 months of consecutive declines but was still down 20% from a year ago.

There were 526,000 multifamily completions in February, down 15% from the previous year. For each apartment starting construction, there are 1.5 apartments completing the construction process.

Discover more from Eye On Housing

Subscribe to get the latest posts sent to your email.


This article was originally published by a eyeonhousing.org . Read the Original article here. .
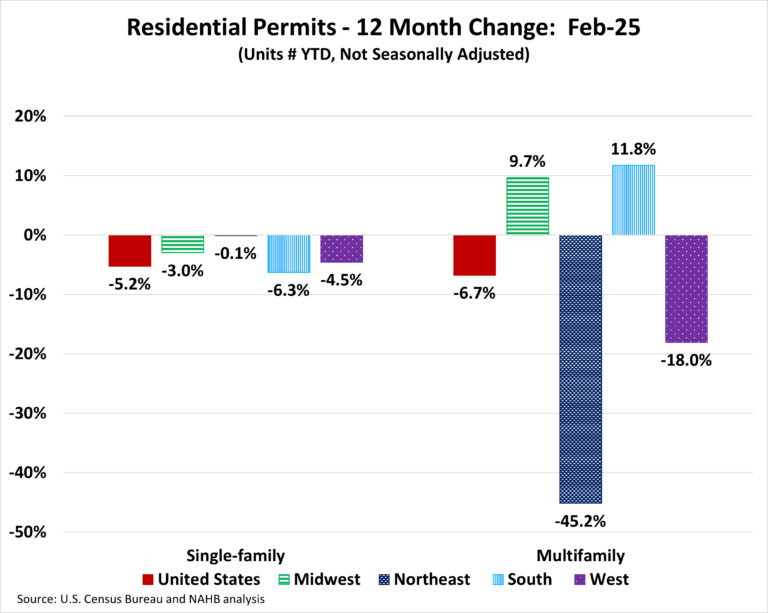

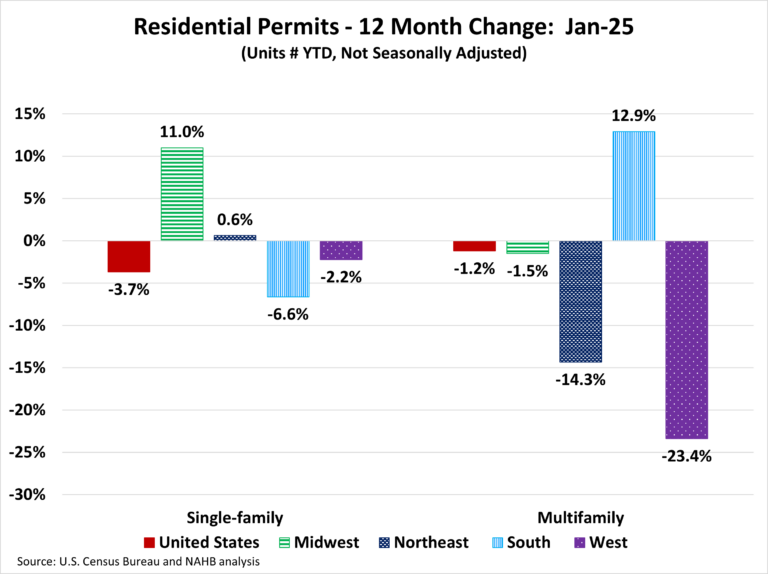
Permits are off to a lower level to start the new year. Over the first month of 2025, the total number of single-family permits issued year-to-date (YTD) nationwide reached 73,115. On a year-over-year (YoY) basis, this is a decline of 3.7% over the January 2024 level of 75,906. For multifamily, the total number of permits issued nationwide reached 38,402. This is 1.2% below the January 2024 level of 38,870.

Year-to-date ending in January, single-family permits were up in the Midwest (+11.0%) and the Northeast (+0.6%) but down in the two remaining regions. The West was down by 2.2% and the South was down by 6.6% in single-family permits during this time. For multifamily permits, three out of the four regions posted declines. The South was up by 12.9% but the West posted a decline of 23.4%, the Northeast declined by 14.3%, and the Midwest declined by 1.5%.

Between January 2025 YTD and January 2024 YTD, 26 states and the District of Columbia posted an increase in single-family permits. The range of increases spanned 525.0% in the District of Columbia to 0.1% in Utah. The remaining 24 states reported declines in single-family permits with Alaska reporting the steepest decline of 23.1% .

The ten states issuing the highest number of single-family permits combined accounted for 65.4% of the total single-family permits issued. Texas, the state with the highest number of single-family permits, issued 12,179 permits over the first month 2025, which is a decline of 4.2% compared to the same period last year. The second highest state, Florida, was down by 13.9%, while the third highest, North Carolina, posted a decline of 11.4%.

Between January 2025 YTD and January 2024 YTD, 22 states recorded growth in multifamily permits, while 27 states and the District of Columbia recorded a decline. In January 2024, Alaska issued zero permits and issued 9 multifamily permits in January 2025. Therefore, the growth rate for Alaska is undefined. The District of Columbia (+1,282.4%) led the way with a sharp rise in multifamily permits from 17 to 235, while Delaware had the biggest decline of 90.9% from 176 to 16.

The ten states issuing the highest number of multifamily permits combined accounted for 67.6% of the multifamily permits issued. Over the first month of 2025, Florida, the state with the highest number of multifamily permits issued, experienced an increase of 48.0%. Texas, the second-highest state in multifamily permits, saw a decline of 23.1%. New York, the third largest multifamily issuing state, decreased by 19.4%.

At the local level, below are the top ten metro areas that issued the highest number of single-family permits.

For multifamily permits, below are the top ten local areas that issued the highest number of permits.

Discover more from Eye On Housing

Subscribe to get the latest posts sent to your email.


This article was originally published by a eyeonhousing.org . Read the Original article here. .

The continued shortage of existing homes for sale has helped to keep new single-family construction growing across all regions, according to the latest National Association of Home Builders release of the Home Building Geography Index (HBGI). Despite persistent factors that continue to affect housing affordability, including a limited supply of buildable lots, rising construction costs, and a shortage of skilled labor, single-family construction grew over all four quarters of 2024. Multifamily construction remained lackluster but did feature some growth in lower density areas.

Single-Family

All HBGI-tracked geographies posted another quarter of growth in the fourth quarter after peaking in the second quarter. The HBGI is constructed using permit data, which has continued to post higher volumes than last year despite residential construction dealing with persistent structural issues.

Among the HBGI geographies, the highest growth in the fourth quarter of 2024 was registered in small metro core counties, which increased 10.3% year-over-year on a four-quarter moving average basis (4QMA). The market with the lowest level of growth was non metro/micro counties which were up 4.8% year-over-year (4QMA).

In terms of market share, single-family construction took place primarily in small metro core county areas, representing 29.1% of single-family construction. The smallest single-family construction market remained non metro/micro county areas, with a 4.2% market share.

Multifamily

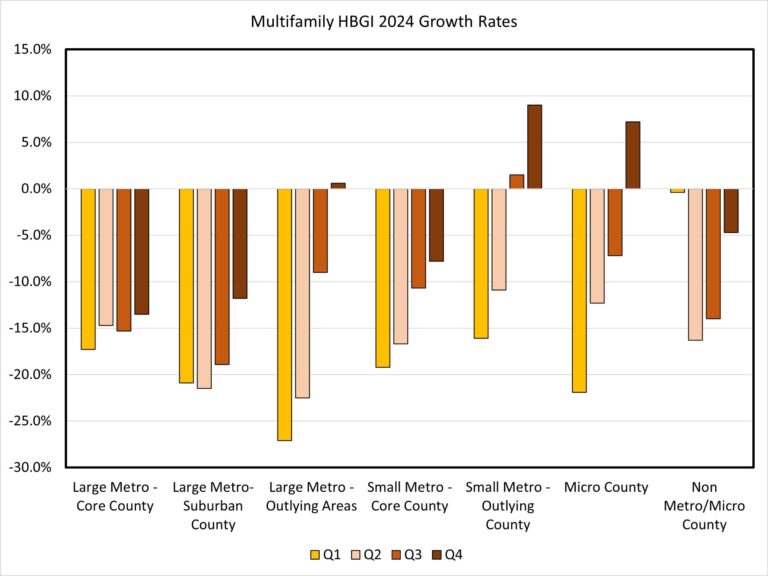
Multifamily construction continued to register negative growth rates across the largest markets, with large metro core county areas posting a decline of 13.5% quartering in the fourth quarter (4QMA). While permit levels remain lower for new multifamily construction, there were some positive signs in less densely populated areas. Small metro outlying county areas had the largest growth rate in the fourth quarter at 9.0%, the second consecutive quarter of growth. These areas make up around 5.0% of the total multifamily construction market.

The fourth quarter of 2024 HBGI data along with an interactive HBGI map can be found at http://nahb.org/hbgi.

Discover more from Eye On Housing

Subscribe to get the latest posts sent to your email.


This article was originally published by a eyeonhousing.org . Read the Original article here. .

Private residential construction spending declined by 0.4% in January, largely driven by a decrease in multifamily construction and home improvement spending. This decline followed three consecutive months of growth, indicating a downward shift in the monthly data.  Despite the monthly drop, spending remains 3.1% higher than a year ago, showing the resilience of the housing market.

  According to the latest U.S Census Construction Spending data, multifamily construction spending fell by 0.7% for the month, extending the downward trends that began in December 2023. This decline aligns with the weakness in the Multifamily Production Index (MPI) and a lower number of multifamily homes under construction. Improvement spending declined by 1.5% in January but was 14.3% higher compared to the same period last year. Meanwhile, spending on single-family construction rose by 0.6% in January, continuing its growth after a  five-month decline from April to August. This growth also aligns with steady builder confidence seen in the Housing Market Index. However, single-family construction remained 0.9% lower than a year ago.

The NAHB construction spending index is shown in the graph below. The index illustrates how   spending on single-family construction has slowed since early 2024 under the pressure of elevated interest rates and concerns over building material tariffs. Multifamily construction spending growth has also slowed down after the peak in July 2023. Meanwhile, improvement spending has increased its pace since late 2023.

Spending on private nonresidential construction was up 1.8% over a year ago. The annual private nonresidential spending increase was mainly due to higher spending for the class of manufacturing ($12.4 billion), followed by the power category ($5.5 billion).

Discover more from Eye On Housing

Subscribe to get the latest posts sent to your email.


This article was originally published by a eyeonhousing.org . Read the Original article here. .

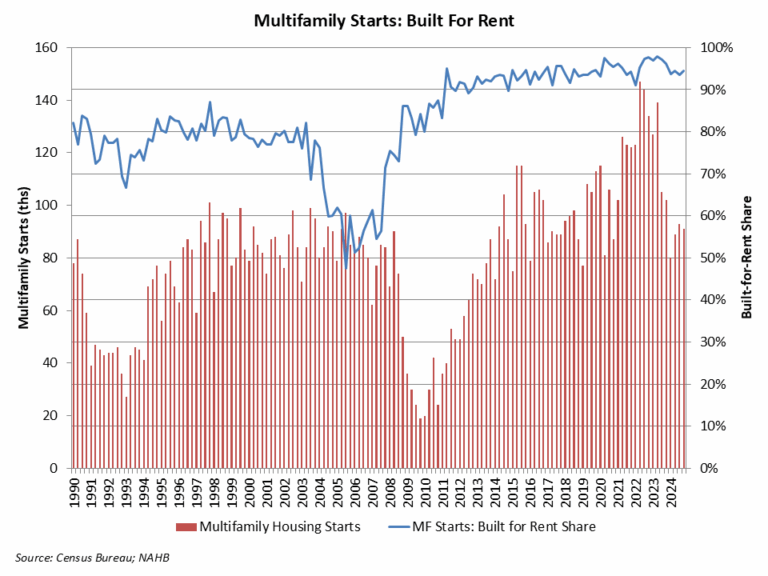
According to NAHB analysis of quarterly Census data, the count of multifamily, for-rent housing starts declined during the fourth quarter of 2024. For the quarter, 91,000 multifamily residences started construction. Of this total, 86,000 were built-for-rent. This was almost 12% lower than the fourth quarter of 2023.

The market share of rental units of multifamily construction starts ticked higher to 95% for the fourth quarter. A historical low market share of 47% for bult-for-rent multifamily construction was set during the third quarter of 2005, during the condo building boom. An average share of 80% was registered during the 1980-2002 period.

For the fourth quarter, there were 5,000 multifamily condo unit construction starts, up from 4,000 a year ago.

An elevated rental share of multifamily construction is holding typical apartment size below levels seen during the pre-Great Recession period. However, according to the fourth quarter 2024 data, the average square footage of multifamily construction starts moved higher to 1,129 square feet. The median edged up to 1,039 square feet. These are notable moves higher off of multidecade lows.

Discover more from Eye On Housing

Subscribe to get the latest posts sent to your email.


This article was originally published by a eyeonhousing.org . Read the Original article here. .

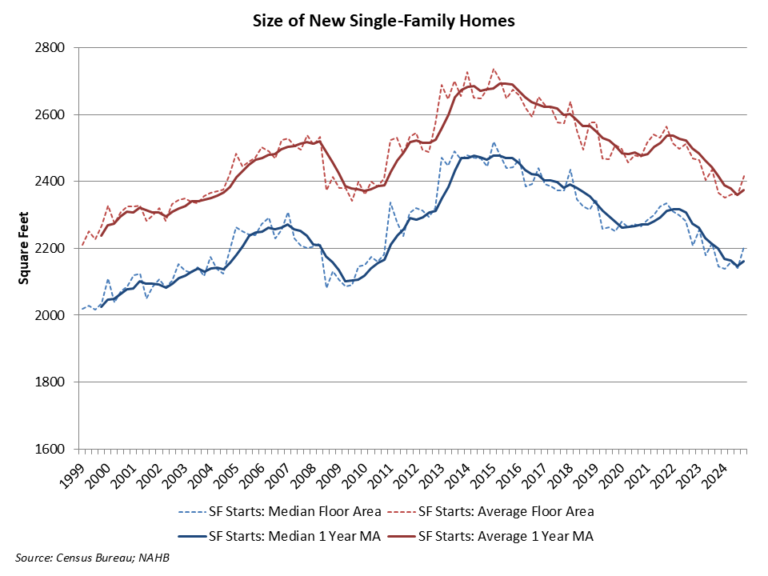
An expected impact of the virus crisis was a need for more residential space, as people used homes for more purposes including work. Home size correspondingly increased in 2021 as interest rates reached historic lows. However, as interest rates increased in 2022 and 2023, and housing affordability worsened, the demand for home size has trended lower. As markets expect some decline for long-term interest rates, will new single-family home size reverse and move higher in 2025? Data from the end of 2024 suggests this may be occurring.

According to fourth quarter 2024 data from the Census Quarterly Starts and Completions by Purpose and Design and NAHB analysis, median single-family square floor area was 2,205 square feet, the highest reading since mid-2023. Average (mean) square footage for new single-family homes registered at 2,417 square feet.

The average size of a new single-family home, on a one-year moving average basis, trended higher to 2,373 square feet, while the median size is at 2,162 square feet.

Home size increased from 2009 to 2015 as entry-level new construction lost market share. Home size declined between 2016 and 2020 as more starter homes were developed. After a brief increase during the post-COVID building boom, home size has trended lower due to declining affordability conditions. As interest rates decline, new home size could level off and increase on a sustained basis in the quarters ahead.

Discover more from Eye On Housing

Subscribe to get the latest posts sent to your email.


This article was originally published by a eyeonhousing.org . Read the Original article here. .

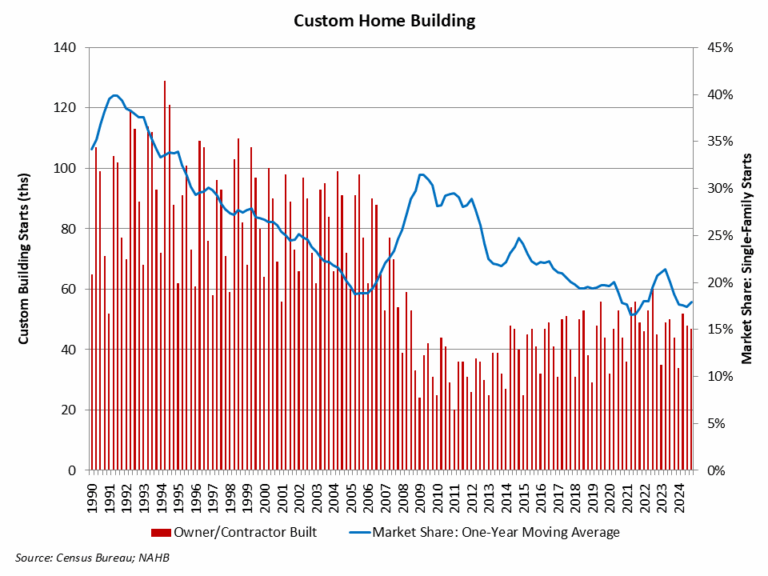
NAHB’s analysis of Census Data from the Quarterly Starts and Completions by Purpose and Design survey indicates gains for custom home builders after a period slight softening of market share. The custom building market is less sensitive to the interest rate cycle than other forms of home building.

There were 47,000 total custom building starts during the fourth quarter of 2024. This marks a 7% increase compared to the fourth quarter of 2023. Over the last four quarters (2024 as a whole), custom housing starts totaled 181,000 homes, just below a 2% increase compared to the prior four quarter total (178,000 in 2023).

Currently, the market share of custom home building, based on a one-year moving average, is approximately 18% of total single-family starts. This is down from a prior cycle peak of 31.5% set during the second quarter of 2009 and the 21% local peak rate at the beginning of 2023, after which spec home building gained market share.

Note that this definition of custom home building does not include homes intended for sale, so the analysis in this post uses a narrow definition of the sector. It represents home construction undertaken on a contract basis for which the builder does not hold tax basis in the structure during construction.

Discover more from Eye On Housing

Subscribe to get the latest posts sent to your email.


This article was originally published by a eyeonhousing.org . Read the Original article here. .

Townhouse construction expanded 10% during 2024, outpacing the rest of the single-family home building market.

According to NAHB analysis of the most recent Census data of Starts and Completions by Purpose and Design, during the fourth quarter of 2024, single-family attached starts totaled 44,000. Over the last four quarters (2024 as a whole), townhouse construction starts totaled a strong 174,000 homes, which is 10% higher than the prior four-quarter period (158,000 in 2023). Townhouses made up 19% of single-family housing starts for the fourth quarter of the year, a data series high.

Using a one-year moving average, the market share of newly-built townhouses stood at 17.3% of all single-family starts for the fourth quarter. With recent gains, the four-quarter moving average market share is near the highest on record, for data going back to 1985.

Prior to the current cycle, the peak market share of the last two decades for townhouse construction was set during the first quarter of 2008, when the percentage reached 14.6% on a one-year moving average basis. This high point was set after a fairly consistent increase in the share beginning in the early 1990s.

The long-run prospects for townhouse construction are positive given growing numbers of homebuyers looking for medium-density residential neighborhoods, such as urban villages that offer walkable environments and other amenities. Where it can be zoned, it can be built.

Discover more from Eye On Housing

Subscribe to get the latest posts sent to your email.


This article was originally published by a eyeonhousing.org . Read the Original article here. .

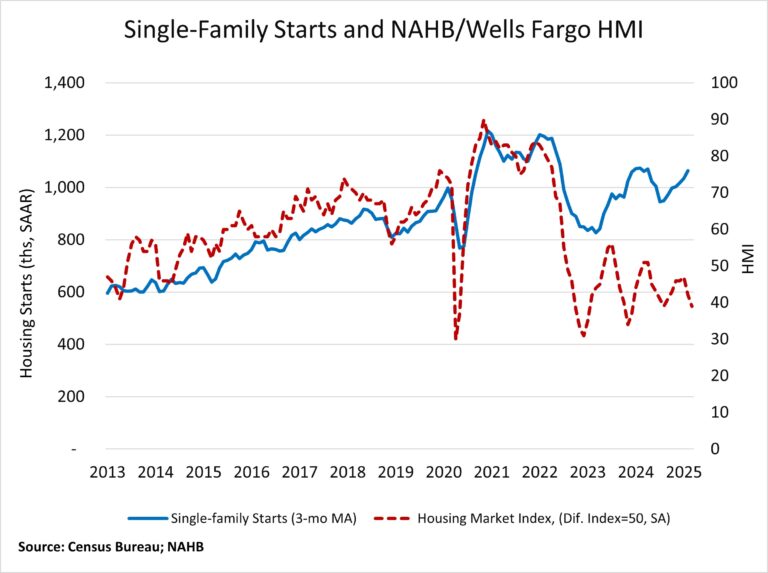
Constrained housing affordability conditions due to ongoing, elevated interest rates led to a reduction in single-family production to start the new year.

Overall housing starts decreased 9.8% in January to a seasonally adjusted annual rate of 1.37 million units, according to a report from the U.S. Department of Housing and Urban Development and the U.S. Census Bureau. The January reading of 1.37 million starts is the number of housing units builders would begin if development kept this pace for the next 12 months.

Within this overall number, single-family starts decreased 8.4% to a 993,000 seasonally adjusted annual rate; the January pace was 1.8% lower than a year ago. The multifamily sector, which includes apartment buildings and condos, decreased 13.5% to an annualized 373,000 pace.

As mirrored in the NAHB/Wells Fargo HMI, high construction costs, elevated mortgage rates and challenging housing affordability conditions are causing builders to approach the market with caution. There are competing upside and downside risks, including discussed tariffs and regulatory reform. Given persistent affordability concerns, reducing inefficient regulatory costs would offer the best policy path to improve attainable housing supply and bring down shelter inflation.

On a regional basis compared to the previous month, combined single-family and multifamily starts are 27.6% lower in the Northeast, 10.4% lower in the Midwest, 23.3% lower in the South and 42.3% higher in the West.

Overall permits increased 0.1% to a 1.48 million unit annualized rate in January. Single-family permits were at a 996,000 annual unit rate, remaining unchanged compared to the previous month. Multifamily permits increased 0.2% to an annualized 487,000 pace.

Looking at regional permit data compared to the previous month, permits are 6.1% lower in the Northeast, 1.8% higher in the Midwest, 0.1% lower in the South and 2.3% higher in the West.

The number of single-family homes under construction in January is down 6.3% from a year ago, to 641,000 units. The number of multifamily units under construction is down 22.1% from a year ago, to 768,000 units.

There were 669,000 multifamily completions in January, up 11% from January 2024. For each apartment starting construction, there are 1.8 apartments completing the construction process.

Discover more from Eye On Housing

Subscribe to get the latest posts sent to your email.


This article was originally published by a eyeonhousing.org . Read the Original article here. .
Pin It