Tag

Confidence

Browsing


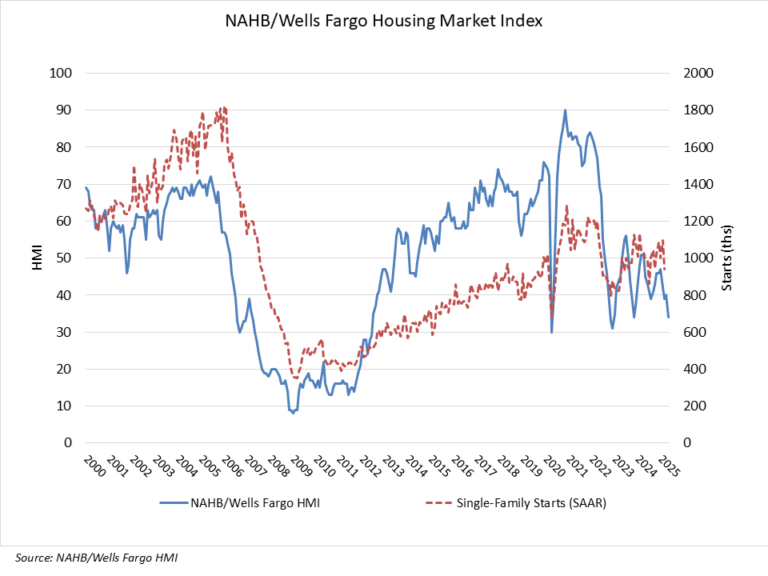
Builder sentiment improved for the third straight month, and builders expect market conditions will continue to improve with Republicans winning control of the White House and Congress.

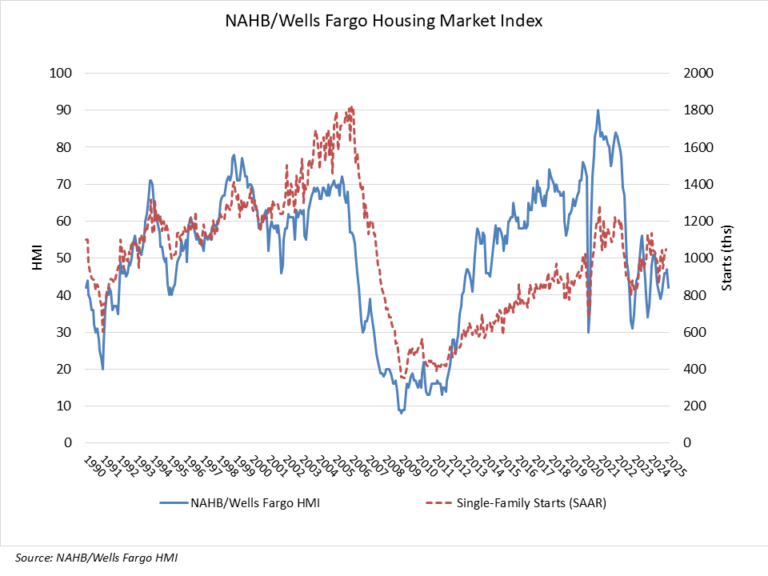
Builder confidence in the market for newly built single-family homes was 46 in November, up three points from October, according to the National Association of Home Builders (NAHB)/Wells Fargo Housing Market Index. Future sales expectations posted a notable increase in the November reading of builder sentiment.

While builder confidence is improving, the industry still faces many headwinds such as an ongoing shortage of labor and buildable lots along with elevated building material prices. Moreover, while the stock market cheered the election result, the bond market has concerns, as indicated by a rise for long-term interest rates. There is also policy uncertainty in front of the business sector and housing market as the executive branch changes hands.

The latest HMI survey also revealed that 31% of builders cut home prices in November. This share has remained essentially unchanged since July, hovering between 31% and 33%. Meanwhile, the average price reduction was 5%, slightly below the 6% rate posted in October. The use of sales incentives was 60% in November, slightly down from 62% in October.

Derived from a monthly survey that NAHB has been conducting for more than 35 years, the NAHB/Wells Fargo HMI gauges builder perceptions of current single-family home sales and sales expectations for the next six months as “good,” “fair” or “poor.” The survey also asks builders to rate traffic of prospective buyers as “high to very high,” “average” or “low to very low.” Scores for each component are then used to calculate a seasonally adjusted index where any number over 50 indicates that more builders view conditions as good than poor.

All three HMI sub-indices were up in November. The index charting current sales conditions rose two points to 49, the component measuring sales expectations in the next six months increased seven points to 64 and the gauge charting traffic of prospective buyers posted a three-point gain to 32.

Looking at the three-month moving averages for regional HMI scores, the Northeast increased four points to 55, the Midwest moved three points higher to 44, the South edged up one point to 42 and the West held steady at 41. HMI tables can be found at nahb.org/hmi.

Discover more from Eye On Housing

Subscribe to get the latest posts sent to your email.


This article was originally published by a eyeonhousing.org . Read the Original article here. .

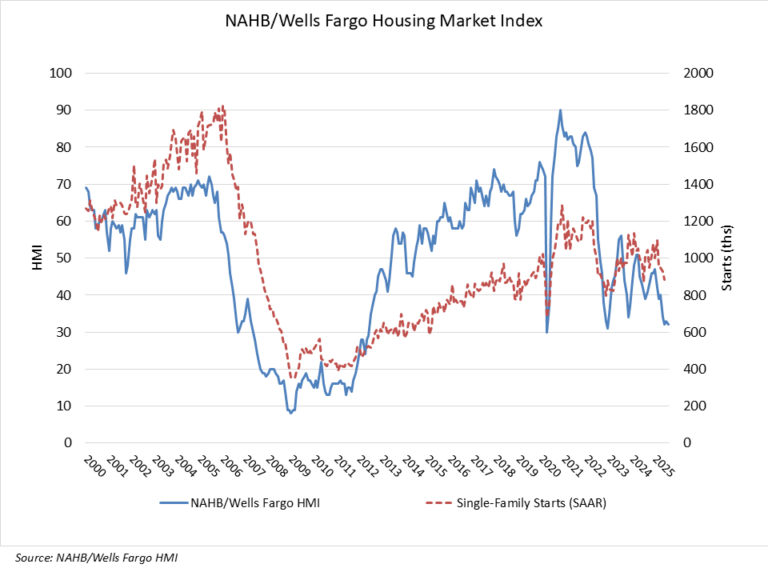
With inflation gradually easing and builders anticipating mortgage rates will moderate in coming months, builder sentiment moved higher for a second consecutive month despite challenging affordability conditions.

Builder confidence in the market for newly built single-family homes was 43 in October, up two points from a reading of 41 in September, according to the National Association of Home Builders (NAHB)/Wells Fargo Housing Market Index (HMI).

Despite the beginning of the Fed’s easing cycle, many prospective home buyers remain on the sideline waiting for lower interest rates. We are forecasting uneven declines for mortgage interest rates in the coming quarters, which will improve housing demand but place stress on building lot supplies due to tight lending conditions for development and construction loans. However, while housing affordability remains low, builders are feeling more optimistic about 2025 market conditions. A wildcard for the outlook remains the election.

The latest HMI survey also revealed that the share of builders cutting prices held steady at 32% in October, the same rate as last month. Meanwhile, the average price reduction returned to the long-term trend of 6% after dropping to 5% in September. The use of sales incentives was 62% in October, slightly up from 61% in September.

Derived from a monthly survey that NAHB has been conducting for more than 35 years, the NAHB/Wells Fargo HMI gauges builder perceptions of current single-family home sales and sales expectations for the next six months as “good,” “fair” or “poor.” The survey also asks builders to rate traffic of prospective buyers as “high to very high,” “average” or “low to very low.” Scores for each component are then used to calculate a seasonally adjusted index where any number over 50 indicates that more builders view conditions as good than poor.

All three HMI indices were up in October. The index charting current sales conditions rose two points to 47, the component measuring sales expectations in the next six months increased four points to 57 and the gauge charting traffic of prospective buyers posted a two-point gain to 29.

Looking at the three-month moving averages for regional HMI scores, the Northeast increased two points to 51, the Midwest moved two points higher to 41, the South held steady at 41 and the West increased three points to 41. The HMI tables can be found at nahb.org/hmi.

Discover more from Eye On Housing

Subscribe to get the latest posts sent to your email.


This article was originally published by a eyeonhousing.org . Read the Original article here. .

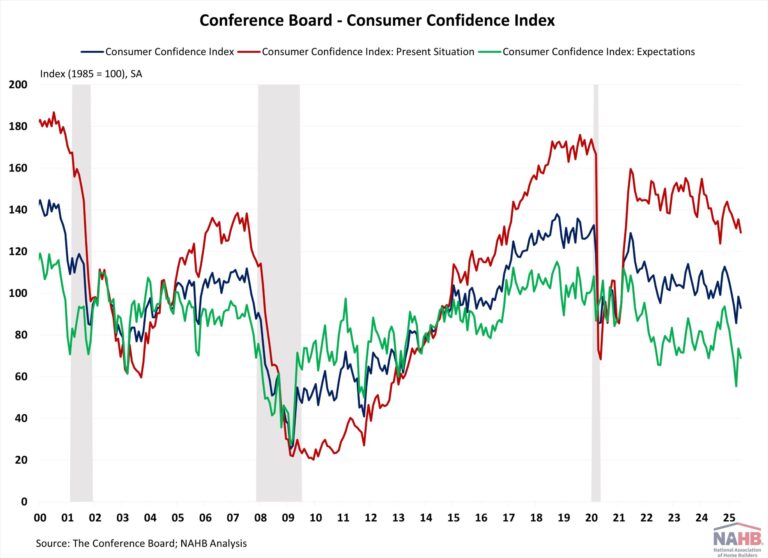
Consumer confidence fell to a 3-month low in September due to growing concerns about the job market, despite the labor market remaining healthy. Recent job growth revisions showed fewer jobs were added in 2023 than initially reported. However, the unemployment rate remained at a relatively low level and wage growth continued to outpace inflation. This suggests the labor market is cooling from its red-hot pace but remains steady. 

The Consumer Confidence Index, reported by the Conference Board, is a survey measuring how optimistic or pessimistic consumers feel about their financial situation. This index fell from 105.6 to 98.7 in September, the largest monthly decline since August 2021. The Consumer Confidence Index consists of two components: how consumers feel about their present situation and about their expected situation. The Present Situation Index decreased 10.3 points from 134.6 to 124.3, and the Expectation Situation Index fell 4.6 points from 86.3 to 81.7, but still remained above the 80 threshold. Historically, an Expectation Index reading below 80 often signals a recession within a year.

Consumers’ assessment of current business conditions turned negative in September. The share of respondents rating business conditions “good” decreased by 2.3 percentage points to 18.8%, while those claiming business conditions as “bad” rose by 2.9 percentage points to 20.2%. Consumers’ assessments of the labor market worsened as well. The share of respondents reporting that jobs were “plentiful” decreased by 1.8 percentage points to 30.9%, while those who saw jobs as “hard to get” increased by 1.5 percentage points to 18.3%.

Consumers were also less optimistic about the short-term outlook. The share of respondents expecting business conditions to improve fell from 19.1% to 18.5%, while those expecting business conditions to deteriorate rose from 14.5% to 16.6%. Similarly, expectations of employment over the next six months were less positive. The share of respondents expecting “more jobs” increased by 0.1 percentage points to 16.4%, and those anticipating “fewer jobs” climbed by 1.3 percentage points to 18.3%.

The Conference Board also reported the share of respondents planning to buy a home within six months. The share of respondents planning to buy a home rose to 5.7% in September. Of those, respondents planning to buy a newly constructed home increased slightly to 0.7%, while those planning to buy an existing home decreased to 2.4%.

Discover more from Eye On Housing

Subscribe to get the latest posts sent to your email.


This article was originally published by a eyeonhousing.org . Read the Original article here. .


A lack of affordability and buyer hesitation stemming from elevated interest rates and high home prices contributed to a decline in builder sentiment in August.

Builder confidence in the market for newly built single-family homes was 39 in August, down two points from a downwardly revised reading of 41 in July, according to the National Association of Home Builders (NAHB)/Wells Fargo Housing Market Index (HMI) released today. This is the lowest reading since December 2023.

Almost three-quarters of the responses to the August HMI were collected during the first week of the month when interest rates averaged 6.73%, according to Freddie Mac. Mortgage rates declined notably the following week to 6.47%, the lowest reading since May 2023.

Challenging housing affordability conditions remain the top concern for prospective home buyers in the current reading of the HMI, as both present sales and traffic readings showed weakness. However, with current inflation data pointing to interest rate cuts from the Federal Reserve and mortgage rates down markedly in the second week of August, buyer interest and builder sentiment should improve in the months ahead.

The August HMI survey also revealed that 33% of builders cut home prices to bolster sales in August, above the July rate of 31% and the highest share in all of 2024. However, the average price reduction in August held steady at 6% for the 14th straight month. Meanwhile, the use of sales incentives increased to 64% in August from 61% in July, and this was the highest level since April 2019.

Derived from a monthly survey that NAHB has been conducting for more than 35 years, the NAHB/Wells Fargo HMI gauges builder perceptions of current single-family home sales and sales expectations for the next six months as “good,” “fair” or “poor.” The survey also asks builders to rate traffic of prospective buyers as “high to very high,” “average” or “low to very low.” Scores for each component are then used to calculate a seasonally adjusted index where any number over 50 indicates that more builders view conditions as good than poor.

The HMI index charting current sales conditions in August fell two points to 44 and the gauge charting traffic of prospective buyers also declined by two points to 25. The component measuring sales expectations in the next six months increased one point to 49.

Looking at the three-month moving averages for regional HMI scores, the Northeast fell four points to 52, the Midwest dropped four points to 39, the South decreased two points to 42 and the West held steady at 37. The HMI tables can be found at nahb.org/hmi.

Discover more from Eye On Housing

Subscribe to get the latest posts sent to your email.


This article was originally published by a eyeonhousing.org . Read the Original article here. .


Confidence in the market for new multifamily housing declined year-over-year in the second quarter of 2024, according to results from the Multifamily Market Survey (MMS) released today by the National Association of Home Builders (NAHB).  The MMS produces two separate indices:  The Multifamily Production Index (MPI) had a reading of 44, a decrease of 12 points year-over-year, while the Multifamily Occupancy Index (MOI) had a reading of 81, falling eight points year-over-year.

Multifamily developers are less optimistic than they were at this time last year, given high interest rates and limited financing availability to develop multifamily properties.  However, financial markets may become more stable later in the year, as recent weak economic data make it more likely that the Federal Reserve will cut interest rates.

Multifamily Production Index (MPI)

The MPI is a weighted average of four key market segments: three in the built-for-rent market (garden/low-rise, mid/high-rise, and subsidized) and the built-for-sale (or condominium) market.  The survey asks multifamily builders to rate the current conditions as “good”, “fair”, or “poor” for multifamily starts in markets where they are active.  The index and all its components are scaled so that a number above 50 indicates that more respondents report conditions as good rather than poor.

Even though all four of the components posted year-over-year declines in the second quarter, sentiment about production of garden/low-rise apartments and subsidized apartments remained in positive territory above 50. The component measuring garden/low-rise fell 11 points to 53, the component measuring subsidized units decreased four points to 51, the component measuring built-for-sale units posted a seven-point decline to 38, and the component measuring mid/high-rise units dropped 18 points to 29 (Figure 1).

Multifamily Occupancy Index (MOI)

The MOI is a weighted average of the three built-for-rent market segments (garden/low-rise, mid/high-rise and subsidized).  The survey asks multifamily builders to rate the current conditions for occupancy of existing rental apartments, in markets where they are active, as “good”, “fair”, or “poor”.  Similar in nature to MPI, the index and all its components are scaled so that a number above 50 indicates more respondents report that occupancy is good than report it as poor. 

Although still well above 50, all three components for the MOI experienced year-over-year declines.  The component measuring garden/low-rise fell nine points to 82, mid/high-rise units decreased seven points to 76, and subsidized units decreased six points to 85 (Figure 2).

The MMS was re-designed last year to produce results that are easier to interpret and consistent with the proven format of other NAHB industry sentiment surveys.  Until there is enough data to seasonally adjust the series, changes in the MMS indices should only be evaluated on a year-over-year basis.

Please visit NAHB’s MMS web page for the full report.

Discover more from Eye On Housing

Subscribe to get the latest posts sent to your email.


This article was originally published by a eyeonhousing.org . Read the Original article here. .
Pin It