The residential construction industry plays a crucial role in driving economic growth and local community development. It has a lasting impact on local communities by creating jobs, improving infrastructure, boosting local businesses, and enhancing property values.
The residential construction industry is more reliant on labor than capital in the United States. As of October 2024, about 3.4 million people work in the residential construction industry in the United States, with 957,000 builders and 2.4 million residential specialty trade contractors.
The NAHB analysis of the Quarterly Census of Employment and Wages (QCEW) data provides an insight into employment and establishment concentration of the residential construction industry across metro areas (MSA).
Location quotients (LQ) are ratios that compare the concentration of the residential construction industry within a metro area to the concentration of the industry nationwide. LQs are used in this article to evaluate the employment and establishment concentration of the residential construction industry in local areas.
Employment
The March 2024 QCEW data indicates that employment in the residential construction industry, while found throughout the country, was more highly concentrated in some metro areas than others.
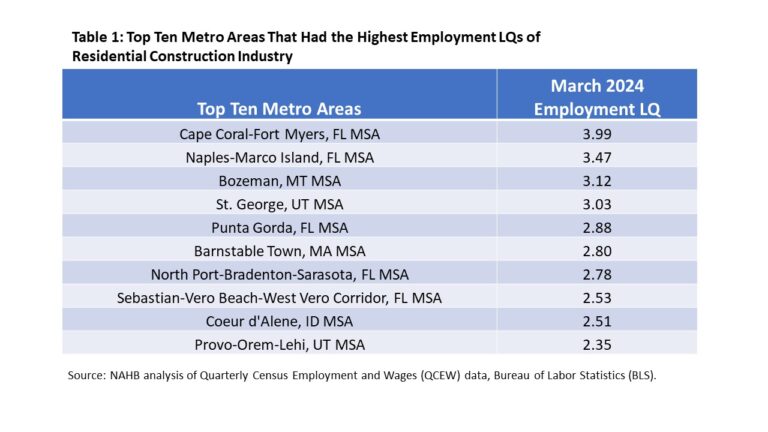
Among 387 metro areas, employment LQs ranged from 0.02 to 3.99. Cape Coral-Fort Myers, FL had the highest employment concentration of the residential construction industry with an LQ of 3.99. It was followed by Naples-Marco Island, FL (LQ: 3.47) and Bozeman, MT (LQ: 3.12).
Florida, experiencing a rapid growth in population, reported a relatively high employment concentration in residential construction. All metro areas in Florida had a higher employment concentration than the nation’s concentration. Moreover, half of the top ten metro areas with the highest employment concentrations of the residential construction industry were in Florida.
Various metro areas in the Mountain Division also have a high reliance on the residential construction industry for employment. Bozeman, MT (LQ: 3.12), St. George, UT (LQ: 3.03), Coeur d’Alene, ID (LQ: 2.51), and Provo-Orem-Lehi, UT (LQ: 2.35) were ranked in the top ten markets with a higher employment concentration of the residential construction industry.
Metro areas in the South reported the three lowest employment LQs of the residential construction industry. The lowest was Owensboro, KY with a LQ of 0.02, followed by Dalton, GA (LQ: 0.03) and Eagle Pass, TX (LQ: 0.05).
Establishment
On aggregate, New York-Newark-Jersey City, NY-NJ, Los Angeles-Long Beach-Anaheim, CA, and Miami-Fort Lauderdale-West Palm Beach, FL were the three metro areas that not only had the most employment in residential construction but also had the largest number of residential construction establishments among all metro areas. However, these three metro areas didn’t have higher establishment concentrations of the residential construction industry than the nation.
Among all the 387 metro areas, 104 of them had a higher establishment concentration of the residential construction industry than the nation. St. George, UT had the highest establishment concentration of the residential construction industry, which was more than three times that of the nation, followed by Barnstable Town, MA (LS: 2.42) and Cape Coral-Fort Myers, FL (LQ: 2.38).
The three metro areas in the South that reported the lowest employment LQs of the residential construction industry also had the lowest establishment LQs of the residential construction industry.
For more information on QCEW, please check the “Handbook of Methods” published by BLS.
Discover more from Eye On Housing
Subscribe to get the latest posts sent to your email.
This article was originally published by a eyeonhousing.org . Read the Original article here. .


