Tag

Built

Browsing


Shares of new single-family homes built with private wells and individual septic systems decreased in 2023, compared with the previous year. NAHB tabulation of data from the Survey of Construction (SOC) indicates approximately 9% of new single-family homes started in 2023 were served by individual wells and 17% had private septic systems. There are large variations for these shares across the nine Census divisions with the corresponding shares reaching 26% and 38% in New England – the highest occurrence rates in the nation.

Nationally, 9% of new single-family homes started in 2023 were served by individual wells, with the majority relying on public water systems, which include community or shared supplies. In New England, where the median lot size is almost 3 times larger than the national average, 26% of new homes used private wells. Private wells were also common in the East North Central division, where nearly 22% of new homes had them. The Middle Atlantic division had the third-highest share at 14%. These divisions, along with the South Atlantic division (13%), surpassed the national average of 9%. Conversely, individual wells were rare in the East South Central and West South Central divisions, accounting for only a 1% share.

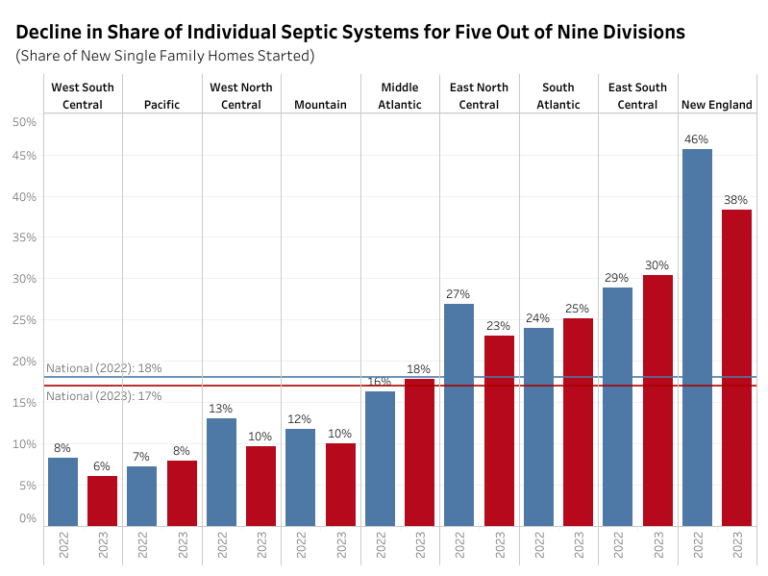
For sewage disposal, 82% of new homes were connected to public sewers (including community or shared sewage/septic systems) in 2023, and 17% utilized individual septic systems. The share of individual septic system decreased from 18% in 2022 to 17% in 2023.

The use of individual septic systems varied by division. In New England, 38% of new homes had private septic systems, while the East South Central, South Atlantic, and East North Central divisions reported 30%, 25%, and 23% shares, respectively. These shares, including the Middle Atlantic (18%), were above the national average of 17%. Shares were below average in the Mountain (10%), West North Central (10%), Pacific (8%), and West South Central (6%) divisions.

Compared to the previous year, the proportion of new single-family homes with individual septic systems fell in five out of nine divisions. Notably, New England saw a decrease from 46% in 2022 to 38% in 2023. Meanwhile, the Pacific, Middle Atlantic, South Atlantic, and East South Central divisions experienced slight increases, ranging from 1% to 2%.

Discover more from Eye On Housing

Subscribe to get the latest posts sent to your email.


This article was originally published by a eyeonhousing.org . Read the Original article here. .

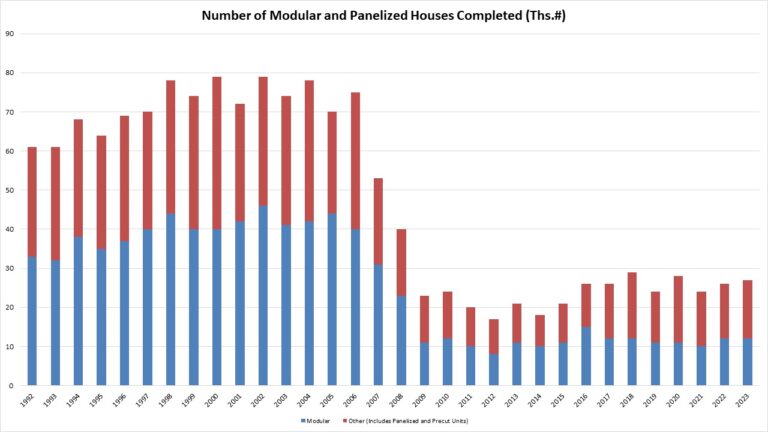
The total market share of non-site built single-family homes (modular and panelized) was just 3% of single-family homes in 2023, according to completion data from the Census Bureau Survey of Construction data and NAHB analysis. This is a slight increase from the 2% share in 2022. This share has been steadily declining since the early-2000s despite the high-level of interest for non-site built construction. This low market share in fact runs counter to some media commentary on off-site construction suggesting recent gains. Nonetheless, there exists potential for market share gains in the years ahead due to the need to increase productivity in the residential construction sector.

In 2023, there were 27,000 total single-family units built using modular (12,000) and panelized/pre-cut (15,000) construction methods, out of a total of 999,000 single-family homes completed. It is worth noting that the Census definitions of off-site construction are relatively narrow. In a separate survey, the Home Innovation Research Labs Survey of U.S. Home Builders has a higher share for panelized construction (5-12%) due to a wider definition of “panelized” construction.

While the Census-measured market share is small, there exists potential for expansion. This 3% market share for 2023 represents a decline from years prior to the Great Recession. In 1998, 7% of single-family completions were modular (4%) or panelized (3%). This marked the largest share for the 1992-2023 period.

One notable regional concentration is found in the Northeast and Midwest. These two regions tie for the highest market share of homes built using non-site build construction methods. In the Northeast, 5% (4,000 homes) of the region’s 61,000 housing units were completed using non-site built construction methods. At the same time, in the Midwest, 5% market share (6,000 homes) of the region’s 126,000 housing units were completed using non-site build construction methods.

With respect to multifamily construction, approximately 7% of multifamily buildings (properties, not units) were built using modular and panelized methods, marking the highest level in the last two decades. This is significantly higher than the 2% share in 2022 and 1% share in 2018-2021. It is notable that modular construction methods accounted for 5% of this share, whereas in previous years it was only panelized construction methods that made up the small share of non-site build methods in multifamily construction.  Prior to last year, the highest levels of modular and panelized methods share in multifamily construction was in 2000 and 2011, where 5% of multifamily buildings were constructed with modular (1%) or panelized construction methods (4%).

Discover more from Eye On Housing

Subscribe to get the latest posts sent to your email.


This article was originally published by a eyeonhousing.org . Read the Original article here. .

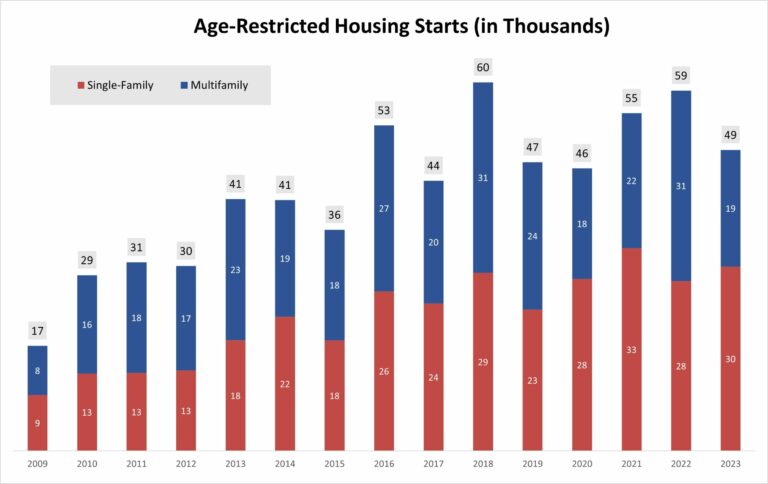
Of the roughly 950,000 single-family and 470,000 multifamily homes that started construction in 2023, 49,000 (30,000 single-family and 19,000 multifamily) were built in age-restricted communities, according to NAHB tabulation of data from the Census’s Survey of Construction. A residential community can be legally age-restricted, provided it conforms to one of the set of rules specified in the Housing for Older Persons Act of 1995. 

NAHB was first successful in persuading HUD and the Census Bureau to collect and publish data on the age-restricted status of new homes in 2009, during the depths of the housing downturn. In 2009, builders started only 17,000 homes in age-restricted communities (9,000 single-family and 8,000 multifamily).  The numbers then increased steadily until reaching 60,000 age-restricted starts (roughly evenly split between single-family and multifamily) in 2018. These numbers fell during the pandemic but rebounded in 2021-2022, almost reaching the peak from 2018.  

In 2023, the total number of age-restricted home starts decreased by approximately 17% from 2022, down to 49,000. Overall, housing starts were lower than the previous year, with single-family and multifamily starts dropping by about 6% and 14%, respectively. However, age-restricted home starts showed a mixed trend: they increased for single-family homes but declined for multifamily homes. This shift was due to a higher percentage of single-family home starts being age-restricted compared to the previous year, while a lower percentage of multi-family home starts fell into this category. 

The SOC data allow for a comparison of the characteristics of new age-restricted single-family homes with other single-family homes started in 2023. The analysis reveals that age-restricted homes were more expensive, with a median price of $500,000, compared to $422,000 for non-age-restricted homes. This follows a similar tendency observed in 2022, when age-restricted homes had a median price of $547,000, compared to $461,000 for non-age-restricted homes.

However, in 2022, the median size was the same for both types of homes, making age-restricted homes more expensive per square foot. In 2023, on the other hand, the median size was 200 square feet larger for age-restricted homes, resulting in the same median price per square foot for both types of homes at $152.63. A difference was also apparent in lot value. Although the median lot size was the same for age-restricted and non-age-restricted lots (0.2 acres), the median value for age-restricted lots was $50,000 compared to $60,000 for non-age-restricted lots.

Additional data from the 2023 SOC reveal that age-restricted homes have distinct characteristics compared to non-age-restricted homes. A higher percentage of age-restricted homes are attached, single-story, and lack a basement. These homes are also more likely to come with patios and porches, but less likely to have decks.  Finally, age-restricted homes are less likely to require a loan and more likely to be purchased for cash, as home buyers who are older have had more of a chance to accumulate the savings and assets (often equity in a previous home) that can be converted to cash.

Discover more from Eye On Housing

Subscribe to get the latest posts sent to your email.


This article was originally published by a eyeonhousing.org . Read the Original article here. .
Pin It