Tag

Builders

Browsing


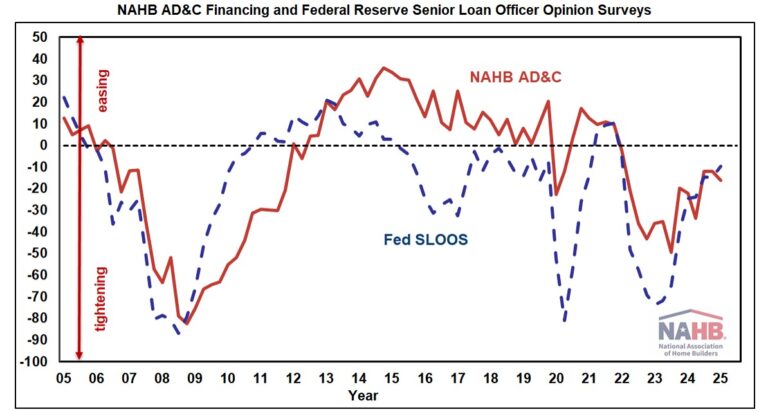
In the third quarter of 2024, borrowers and lenders agreed, as they have over most of the past three years, that credit for residential Land Acquisition, Development & Construction (AD&C) tightened. On the borrower’s side, the net easing index from NAHB’s survey on AD&C Financing posted a reading of -12.0 (the negative number indicates credit was tighter than in the previous quarter). On the lender’s side, the comparable net easing index based on the Federal Reserve’s survey of senior loan officers posted a similar reading of -14.8.  Although the additional net tightening was relatively mild in the third quarter (as indicated by negative numbers that were smaller, in absolute terms, than they had been at any time since 2022 Q1), both surveys indicate that credit has tightened for eleven consecutive quarters—so credit for AD&C must now be significantly tighter than it was in 2021.   

According to  NAHB’s survey, the most common ways in which lenders tightened in the third quarter were by lowering the loan-to-value (or loan-to-cost) ratio, and requiring personal guarantees or collateral not related to the project—each reported by 61% of builders and developers. After those two, reducing the amount lenders are willing to lend was in the third place, with 56%.

Additional information from the Fed’s survey of lenders—including measures of demand and net easing for residential mortgages—is discussed in an earlier post.

Although the availability of credit for residential AD&C was tighter in the third quarter, builders and developers finally got some relief from the elevated cost of credit that has prevailed recently. In the third quarter, the contract interest rate decreased on all four categories of AD&C loans tracked in the NAHB survey. The average rate declined from 9.28% in 2024 Q2 to 8.50% on loans for land acquisition, from 9.05% to 8.83% on loans for land development, from 8.98% to 8.54% on loans for speculative single-family construction, and from 8.55% to 8.11% on loans for pre-sold single-family construction.

More detail on credit conditions for builders and developers is available on NAHB’s AD&C Financing Survey web page.

Discover more from Eye On Housing

Subscribe to get the latest posts sent to your email.


This article was originally published by a eyeonhousing.org . Read the Original article here. .

The majority of NAHB builder members are small businesses, according to the annual census of its members NAHB has been conducting since 2008. The most recent installment of the census was conducted at the end of 2023 and covered business activity through 2023.

The census shows that, on average, NAHB builders started 59.2 homes in 2023 (37.3 single-family and 21.9 multifamily). However, the median number of homes started was only six. Because the data include a small percentage of very large builders, the average number of starts is much higher than the median. For that reason, the median may better represent the experience of the typical NAHB builder.

Another, conventional way to evaluate the size of a business is by the annual revenue it generates. In the 2023 NAHB census, 14% of builders reported a dollar volume of less than $500,000, 12% reported between $500,000 and $999,999, 38% between $1.0 and $4.9 million, 15% between $5.0 and $9.9 million, 6% between $10.0 million and $14.9 million, and 14% reported $15.0 million or more. Only 1% reported no business activity at all in 2023. The median edged up to $3.4 million (from $3.3 million in 2021 and 2022). For comparison, the Small Business Administration’s size standards classify residential builders and remodelers as small if they have average annual receipts of $45.0 million or less ($34.0 million or less for land developers).

Historically, NAHB initiated the current version of its member census during the industry-wide downturn of 2008, when the median annual revenue of builder members was only around $1.0 million. Median annual revenue began rising in 2013, as the industry slowly recovered, plateauing at $2.6 to $2.7 million from 2017 through 2020, before jumping to $3.3 million in 2021 and 2022 and then edging up by another $0.1 million in 2023.

Due to their status as small businesses and extensive use of subcontractors, many builders carry relatively few employees on their payrolls. In NAHB’s 2023 census, builder members reported a median of six employees, including employees in both construction and non-construction jobs.

Whether based on the median of six employees, the median of six homes started, or the median annual revenue of $3.4 million, it is safe to conclude that the majority of NAHB’s builder members qualify as small businesses.

For more detail on the 2023 NAHB Builder Member Census, including a profile for each of the seven major categories of builder, please see the July 2024 Special Study.

Discover more from Eye On Housing

Subscribe to get the latest posts sent to your email.


This article was originally published by a eyeonhousing.org . Read the Original article here. .


During the second quarter of 2024, credit for residential Land Acquisition, Development & Construction (AD&C) continued to tighten and became even more expensive for most types of loans, according to NAHB’s survey on AD&C Financing. The survey was conducted in July and asked specifically about financing conditions in the second quarter, predating the release of some relatively weak economic data that has raised prospects for monetary policy easing.

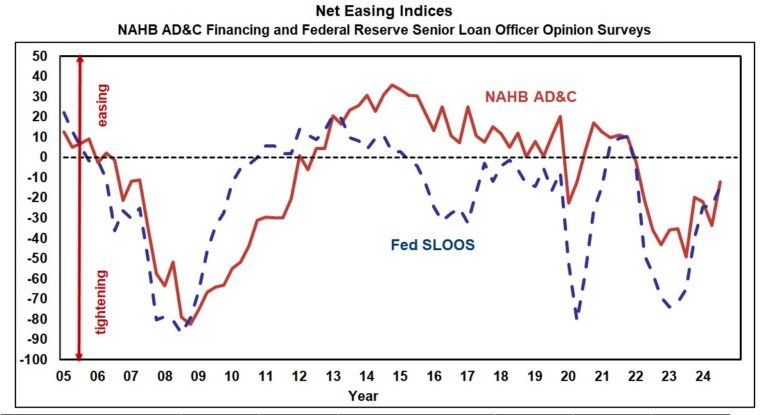
The net easing index derived from the survey posted a reading of -33.7 in the second quarter (the negative number indicating that credit was tighter than in the previous quarter). The comparable net easing index based on the Federal Reserve’s survey of senior loan officers posted a similar result, with a reading of -23.8—marking the tenth consecutive quarter of borrowers and lenders both reporting tightening credit conditions.

According to the NAHB survey, the most common ways in which lenders tightened in the second quarter were by reducing the amount they are willing to lend, and by lowering the loan-to-value (or loan-to-cost) ratio, each reported by 85% of builders and developers. After those two ways of tightening, three others tied for third place: increasing documentation, increasing the interest rate, and requiring personal guarantees or other collateral unrelated to the project, each reported by exactly half of the borrowers.

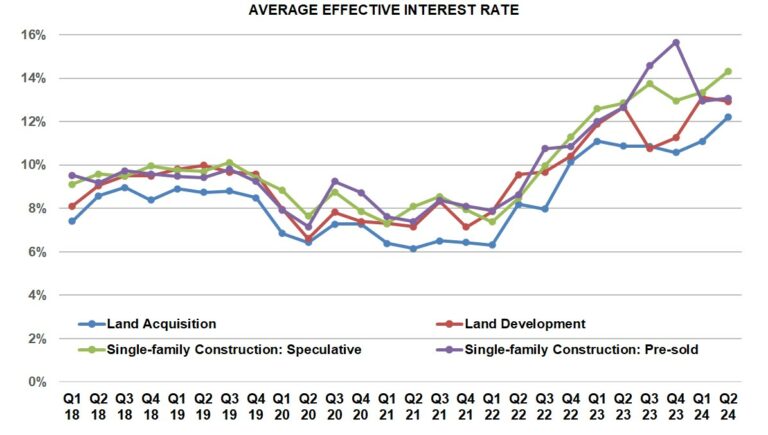
As is often the case, as credit becomes less available it also tends to become more expensive. In the second quarter, the contract interest rate increased on all four categories of AD&C loans tracked in the NAHB survey: from 8.40% in 2024 Q1 to 9.28% on loans for land acquisition, from 8.07% to 9.05% on loans for land development, from 8.24% to 8.98% on loans for speculative single-family construction, and from 8.38% to 8.55% on loans for pre-sold single-family construction.

In addition to the contract rate, initial points charged on the loans can be an important component of the overall cost of credit, especially for loans paid off as quickly as typical single-family construction loans. Trends on average initial points were mixed in the second quarter. The average charge on loans for land acquisition was unchanged at 0.88%. The average declined from 0.85% to 0.70% on loans for land development, and from 0.57% to 0.47% on loans for pre-sold single-family construction. On the other hand, on loans for speculative single-family construction, average initial points increased from 0.76% to 0.89%.

Irrespective of changes in points, increases in the underlying contract rate were sufficient to drive up the average effective interest rate (calculated taking both contract rate and initial points into account), on three of the four categories of AD&C loans in the second quarter. The average effective rate increased from 11.09% to 12.22% on loans for land acquisition, from 13.35% to 14.32% on loans for speculative single-family construction, and from 12.95% to 13.08% on loans for pre-sold single-family construction. Meanwhile, the average effective rate declined on loans for land development—from 13.10% in 2024 Q1 to 12.93%.

The average effective rates on loans for land acquisition and speculative single-family construction in the second quarter of 2024 were the highest they’ve been since NAHB began collecting the information in 2018. However, there’s a reasonable chance the situation will improve in the third and fourth quarters, as the Federal Reserve has begun signaling its intent to cut rates later this year.

More detail on credit conditions for builders and developers is available on NAHB’s AD&C Financing Survey web page.

Discover more from Eye On Housing

Subscribe to get the latest posts sent to your email.


This article was originally published by a eyeonhousing.org . Read the Original article here. .
Pin It