Tag

Analysis

Browsing


A key indicator of the labor market is the labor force participation rate. This rate is the percentage of working-age adults in a population who are working or looking for work. The rate is a critical measure connected to both housing demand and housing supply (via the construction labor force).

According to the Employment Situation Summary reported by the Bureau of Labor Statistics (BLS), the labor force participation rate remained at 62.5% for the third month in December 2024. After the labor force participation rate reached 67.3% at the beginning of 2000, it has been trending lower. When COVID-19 hit the labor market, the labor force participation rate dropped dramatically from 63.3% in February 2020 to 60.1% in April 2020. The latest labor force participation rate remains below its pre-pandemic levels of 63.3% at the beginning of 2020.

The participation rate is directly connected to the supply of labor. Labor supply varies across different demographic groups, such as age, gender, race, and educational attainment.

Gender

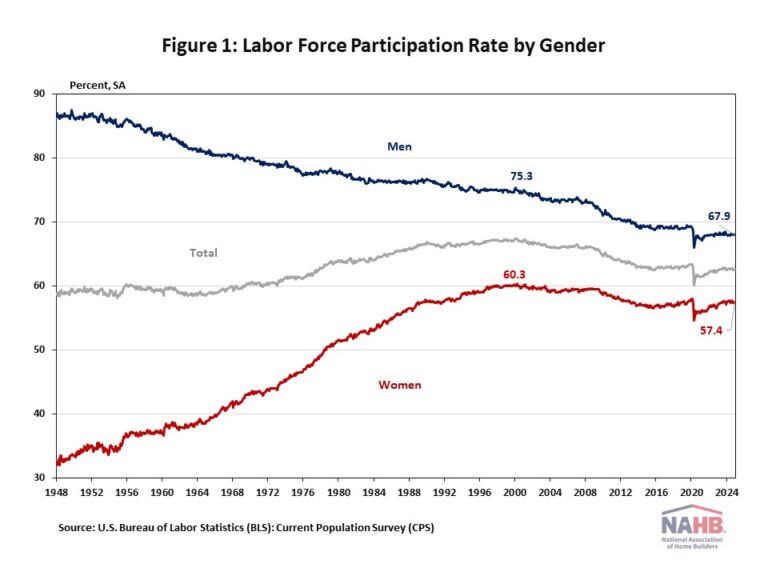
Over time, labor force participation changed dramatically by gender due to evolving societal norms around gender roles. Historically, women experienced a significant increase in labor force participation while men’s participation rates declined. However, over the past 20 years both genders’ labor force participation rates have moved in parallel and been trending downwards. Women’s labor force participation rate is 2.9 percentage points below the peak level in 2000 of 60.3%, while men’s labor force participation rate is 7.4 percentage points lower than the level in 2000 of 75.3%.

According to the latest data from the Current Population Survey (CPS), women currently make up roughly half of the U.S. labor force, representing about 47% of the labor force market. By industry, women accounted for more than half of all workers within several sectors in 2023, such as education and health services (74.4%), other services (53.3%), financial activities (51.1%), and leisure and hospitality (50.8%). Comparably, women were substantially underrepresented (relative to their share of total employment) in manufacturing (29.5%), agriculture (29.3%), transportation and utilities (24.3%), mining (15.3%), and construction (10.8%).

Men tend to have a higher labor force participation rate than women historically, even though this gap has narrowed from 54.7 percentage points in January 1948 to a difference of 10.5 percentage points in December 2024.

Age

The labor force participation rate differs across age groups as well. People ages 65 and older had the lowest labor force participation rate of 19.2%, followed by the youngest age group (16-19 years old) with a participation rate of 36.9%.

Among all age groups, workers aged 25-54, also known as prime-age workers, have the highest labor force participation rate of 83% in 2023. They form the core of the U.S. labor force, accounting for nearly two-thirds (63.8%) of the total labor force. Prime-age workers’ labor force participation rate has fully recovered from the COVID-19 pandemic, surpassing the prior peak of February 2020. The high labor force participation among prime-age men and the rapid increase in prime-age women’s labor force participation contributed to the increase in the labor force over time. By December 2024, prime-age women’s participation rate had hovered near its highest level of 78.1% on record, and 89.0% of prime-age men stayed in the labor force market.

Race and Ethnicity

Labor force participation varies among the largest race and ethnic groups living in the United States, and each group’s labor participation differs according to their gender as well.

Men had a higher labor force participation rate than women in each racial and ethnic group. Among men ages 16 years and over, Hispanic men were the most likely to be in the labor force, with a participation rate of 75.1%, followed by Asian men (76.8%), White men (68.2%), and Black men (65.6%). Among women ages 16 and over, Black women (61.0%) were most likely to participate in the labor force, followed by Hispanic women (58.7%), Asian women (58.1%), and White women (56.5%).

Educational Attainment

Higher levels of educational attainment are generally associated with higher labor force participation rates and lower unemployment rates. It is true for both men and women, and the four selected racial and ethnic groups that people with higher educational attainment tend to have greater employment opportunities and potentially later retirement ages.

With the same level of educational attainment, men are more likely to work than women. Among men with less than a high school diploma, the labor force participation rate was 59.4%, compared to a 34.3% participation rate for women with the same level of educational attainment. The gap of the labor force participation rate between men and women narrows as people achieve higher educational attainment. Women with the highest broad level of education (a bachelor’s degree or higher) have a 69.6% participation rate, a 7.3 percentage point difference from men with the same level of education (76.9%).

Discover more from Eye On Housing

Subscribe to get the latest posts sent to your email.


This article was originally published by a eyeonhousing.org . Read the Original article here. .

Residential improvement spending softened in 2023 due to elevated interest rates, high inflation, and sluggish home sales. According to the Bureau of Economic Analysis’ National Income and Product Accounts (NIPA), expenditures for residential home improvements rose 2% to $363 billion in 2023, from $356 billion in 2022. The 2% year-over-year (YOY) gain in 2023 marks the smallest YOY gain since 2011. This annual data indicates that the YOY gain in residential improvement spending slowed, but the remodeling market remained solid.

In this article, NAHB’s analysis of the 2023 Home Mortgage Disclosure Act (HMDA) data provides insight into remodeling activity in 2023 by age group, and by U.S. states and counties. The 2023 HMDA data, published by the Consumer Financial Protection Bureau (CFPB), covers detailed information on residential mortgage lending in 2023, including the type, purpose, and characteristics of home mortgage applications or purchased loans, and demographic and other information about loan applicants.

According to the 2023 HMDA data, the number of home improvement loan applications declined by 17% in 2023, compared to the previous year. Moreover, the total amount of home improvement loans was about 44 billion (24%) less than the total amount in 2022.

Age Group Analysis:

Figure 1 below presents the number of home improvement loan applications by applicants’ age from 2018 to 2023. Among all age groups, the number of home improvement loan applications surged in 2022 and declined in 2023. Compared to 2022, the number of home improvement loan applications decreased by 23% in 2023 for applicants aged between 25 and 34 and between 35 and 40. Applicants between the ages of 45 and 54 remained the largest age group to apply for home improvement loan applications, even though the number of loan applications for this age group reduced by 18% in 2023.

For applicants under 55 years old and above 74 years old, the number of loan applications in 2023 was higher than the pre-pandemic level in 2018 and 2019. Meanwhile, applicants aged between 55 and 74 had a lower number of loan applications in 2023 than in 2018 and 2019. As interest rates reached historically high levels in 2023, homeowners used savings to pay for home improvements, avoiding the extra expense of interest on loans.

State-Level Analysis:

While remodeling activity changed among different age groups, remodeling has also varied across geographic locations due to the cost of living, local economic conditions, and house prices.

With respect to total home improvement loan applications, California had the highest number of home improvement loan applications in 2023, with 118,649 applications. Florida came in second with 102,746 home improvement loan applications. Wyoming and Alaska had the lowest total numbers of home improvement loan applications with 1,312 and 1,358, respectively.

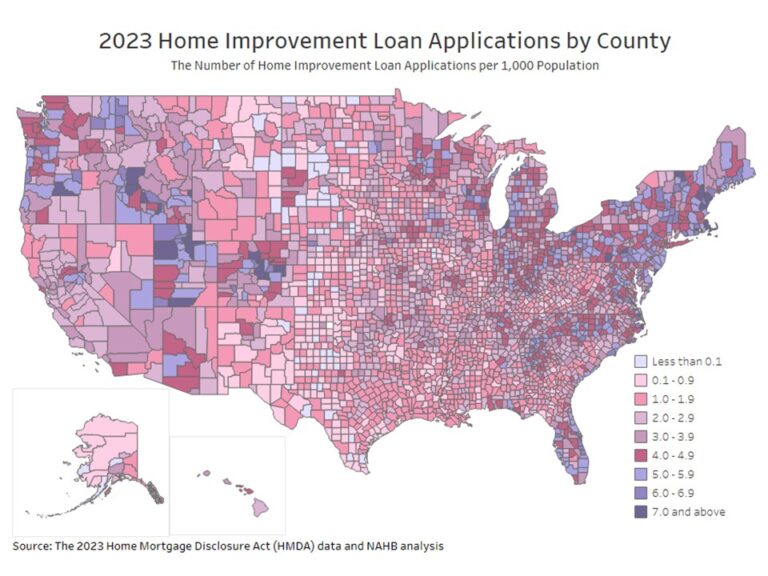
When we look at home improvement loan applications per 1,000 population, two states in New England, Rhode Island and New Hampshire, had the highest number of home improvement loan applications, with a rate of 6.4 and 6.0 applications per 1,000 population, respectively. Louisiana had the lowest number of home improvement loan applications, with a rate of 1.6 applications per 1,000 population.

In total, there were 3.7 loan applications for home improvements for every 1,000 population in the United States. California, the most populous state of the United States, reported 3.0 applications per 1,000 population, which is lower than the national average rate.

County-Level Analysis:

The analysis of county-level home improvement loan applications per 1,000 population reveals that the aggregate market population is not significantly related to the number of per capita home improvement loan applications. In 2023, the top 10 most populated counties in the United States had an average rate of 2.6 loan applications per 1,000 population. Los Angeles County in California, one of the most populous counties, reported a rate of 2.8 loan applications per 1,000 population in 2023.  Meanwhile, some counties with a lower population had a higher loan application rate (that is, the number of home improvement loan applications per 1,000 population). For example, Nantucket County in Massachusetts, with a population of about 14,000, had the highest loan application rate of 11.1 among all the counties in the United States. Camas County in Idaho, with roughly one thousand population, had a loan application rate of 8.9, higher than about 99.7% of the counties in the United States.

Additionally, the analysis finds that home improvement loan applications are relatively more common in the Mountain and New England Divisions. In total, there were 43 counties that reported 7 or higher home improvement loan applications per 1,000 population, and more than 72% of these counties were in the Mountain and New England Divisions. None of these 43 counties were in the West South Central, East South Central, or West North Central Divisions. The top five counties with the highest home improvement loan application rate were: Nantucket County (MA), Grand Isle County (VT), Dare County (NC), Boise County (ID), and Barnstable County (MA).

Discover more from Eye On Housing

Subscribe to get the latest posts sent to your email.


This article was originally published by a eyeonhousing.org . Read the Original article here. .

State & local tax revenue from property taxes paid reached $780.9 billion in the four quarters ending in the second quarter of 2024 (seasonally adjusted), according to the Census Bureau’s estimates. This is a 1.7% increase from the revised $767.7 billion in the four quarters ending in the first quarter of 2024. Year-to-date, total state and local tax revenue was $1.05 trillion. This was 5% higher than the $995.7 billion through the first two quarters of 2023.

The 1.7% increase in the four-quarter property tax revenue was down from the previous quarter of 1.8%. Property tax revenues have continued to grow above the average rate of 0.96% since 2011, with this quarter marking the seventh consecutive quarter of above average growth.

Year-over-year, property tax revenue was 9.1% higher. Year-over-year growth in property tax revenue has consistently been above 9% for four consecutive quarters. Dating back to 2012, the average year-over-year growth is 4.0%.

The property tax share of total state & local tax collections in the second quarter stood at 37.8%, down from 37.9%. This was the first decline in the share since its recent trough in the third quarter of 2022 (33.7%).

Of total collections, property tax made up the largest share, followed by sales tax at 28.0%. Individual income tax represented 25.5% of tax revenue, while corporate tax made up the remaining 8.7% of revenues for state & local revenues in the second quarter of 2024.

Over the past decade, state & local governments have been most reliant on property taxes for revenue. Sales tax has had an increased importance since 2023, when the share of sales tax of total revenues grew above individual income tax shares. See the chart below for the trends of total tax revenues shares.

Discover more from Eye On Housing

Subscribe to get the latest posts sent to your email.


This article was originally published by a eyeonhousing.org . Read the Original article here. .

Pin It