Tag

Activity

Browsing


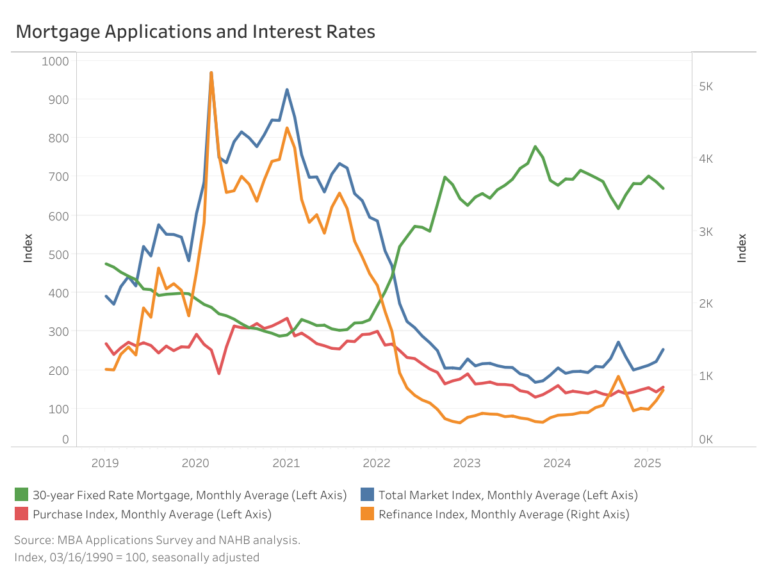
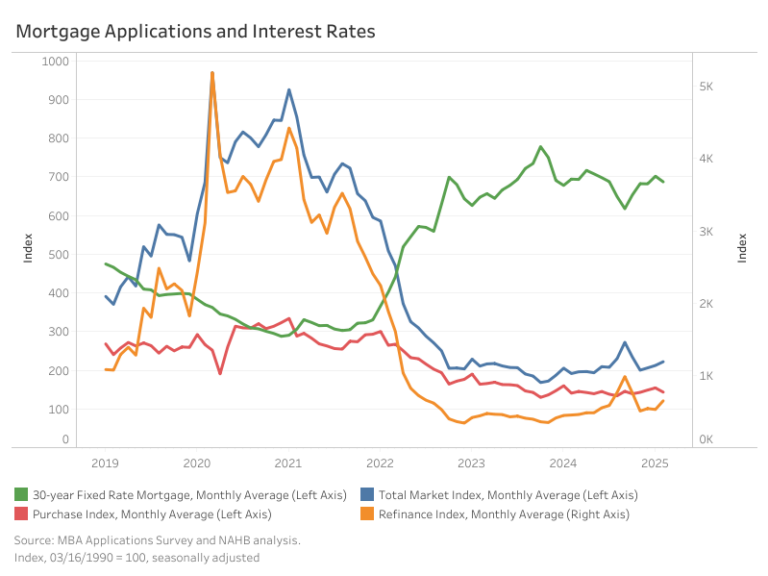
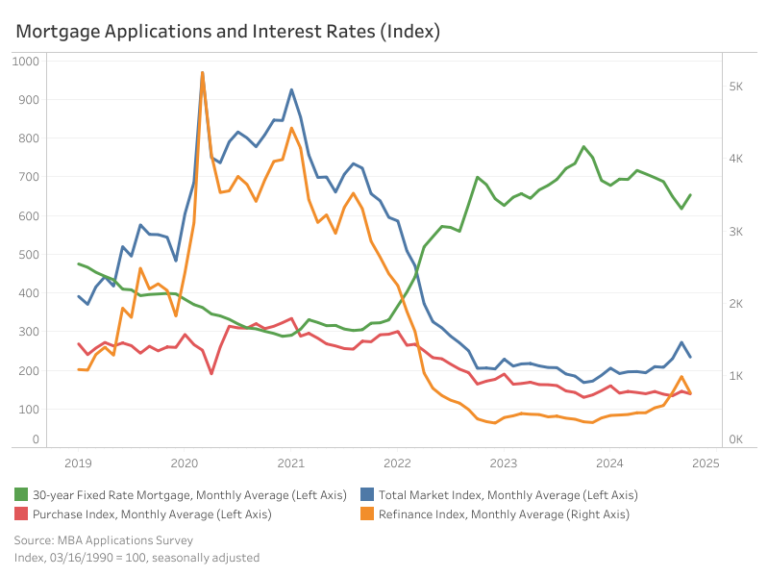
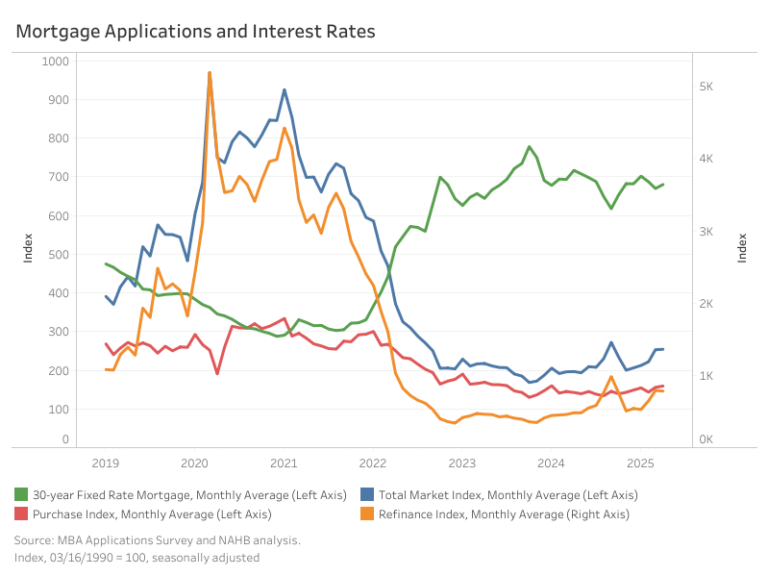
The Market Composite Index, a measure of mortgage loan application volume by the Mortgage Bankers Association’s (MBA) weekly survey, decreased 14.5%, month-over-month, in November on a seasonally adjusted (SA) basis. The slowdown in mortgage activity can be attributed to higher mortgage rates as the ten-year Treasury yield increased in November, reflecting uncertainties surrounding the elections.

The market decline was reflected primarily in the Refinance Index (SA), which decreased by 33.2% month-over-month. Meanwhile, the Purchase Index (SA) showed a modest increase of 2.7% over the same period. However, compared to October 2023, the Market Composite Index is up by 16.4%, with the Purchase Index seeing a slight 4.8% increase and the Refinance Index higher by 45.9%.

The average contract rate for 30-year fixed mortgage rate per the MBA survey for November averaged at 6.8%, 29 basis points (bps) higher month-over-month in response to a higher ten-year Treasury rate.

Loan size metrics also reflected market adjustments. The average loan size for the total market (including purchases and refinances) shrank 2.9% month-over-month on a non-seasonally adjusted (NSA) basis, decreasing from $389,800 to $378,400. Loan sizes for purchasing and refinancing decreased. Purchase loans averaged $436,200, down 2.7% from $448,300, while refinance loans saw a sharper 9.9% decrease, with the average loan size falling from $322,500 to $290,600. Adjustable-rate mortgages (ARMs) also declined 6.0%, from $1.15 million to $1.08 million.

Discover more from Eye On Housing

Subscribe to get the latest posts sent to your email.


This article was originally published by a eyeonhousing.org . Read the Original article here. .


The Market Composite Index, a measure of mortgage loan application volume by the Mortgage Bankers Association’s (MBA) weekly survey, decreased 13.9% month-over-month on a seasonally adjusted (SA) basis due to higher mortgage rates. This decline was reflected in both the Purchase and Refinance Indices, which fell by 4.4% and 23%, respectively. However, compared to October 2023, the Market Composite Index is up by 39%, with the Purchase Index seeing a slight 1.9% increase and the Refinance Index higher by 149.9%.

The average 30-year fixed mortgage rate reversed its downward trajectory with an increase of 36 basis points (bps), following volatility in the ten-year Treasury yield. This brought the rate back to around the same level as it was in August at 6.53%. However, compared to its peak last October, the current rate is 125 bps lower.

The average loan size for the total market (including purchases and refinances) was $390,225 on a non-seasonally adjusted (NSA) basis, a decrease of 2.6% from September. Purchase loans grew by 2.1% to an average of $448,675, while refinance loans declined by 11.3% to $323,750. Adjustable-rate mortgages (ARMs) saw a modest decrease of 3.4% in average loan size from $1.19 million to $1.15 million.

Discover more from Eye On Housing

Subscribe to get the latest posts sent to your email.


This article was originally published by a eyeonhousing.org . Read the Original article here. .


A score higher than 50 indicates that more firms reported an increase in their business expectations than reported a decrease.

Construction Firms

1. Business activity outlook increased. The Expected Business Activity Indicator, related to project inquiries and new committed projects, increased by 10 points, to 62, for the fourth quarter of 2024, from 52 for the third quarter of 2024. This means more construction firms anticipate quarter-over-quarter growth than anticipate a decline.

Expectations for project inquiries increased by 7 points, to 59 (from 52 for Q3), and expectations for new committed projects increased by 12 points, to 64 (from 52 for Q3).

Both build-only and design-build firms are more optimistic for Q4 than they were for the previous quarter. The expected activity indicator for build-only firms increased 9 points, to 62 (from 53 for Q3), and for design-build firms it increased 10 points, to 61 (from 51 for Q3).

The indicator is based on survey questions about whether businesses expect the number of project inquiries and new projects to increase, decrease or remain unchanged in the coming three months compared with the previous three months.


This article was originally published by a www.houzz.com . Read the Original article here. .


The Market Composite Index, a measure of mortgage loan application volume by the Mortgage Bankers Association’s (MBA) weekly survey, rose 18.4% month-over-month on a seasonally adjusted (SA) basis, driven primarily by a surge in refinancing activity. Compared to September 2023, the index increased by 47%. The Market Composite Index which includes the Purchase and Refinance Indices saw monthly gains, rising by 8.6% and 29%, respectively. Year-over-year, the Purchase Index showed a modest increase of 1.9%, while the Refinance Index jumped 149.9%.

The average 30-year fixed mortgage rate continued its downward trajectory for the fifth consecutive month, with September seeing a decline of 31 basis points (bps), bringing the rate to 6.18%. This is 117 bps lower than the same time last year.

Loan sizes also saw growth across the board. The average loan size for the total market (including purchases and refinances) was $400,450 on a non-seasonally adjusted (NSA) basis, an increase of 5.1% from August. Purchase loans grew by 3% to an average of $439,600, while refinance loans jumped by 11.6% to $363,825. Adjustable-rate mortgages (ARMs) saw an 8.2% increase in average loan size, rising from $1.1 million to $1.2 million.

Discover more from Eye On Housing

Subscribe to get the latest posts sent to your email.


This article was originally published by a eyeonhousing.org . Read the Original article here. .


The Market Composite Index, a measure of mortgage loan application volume by the Mortgage Bankers Association’s (MBA) weekly survey, saw a month-over-month increase of 10.7% on a seasonally adjusted (SA) basis. Compared to last August, the index increased by 20.8%. While the Purchase Index declined by 2.9%, month-over-month, the Refinance Index jumped 30.8% as borrowers took advantage of the declining mortgage rates to refinance higher-rate loans. On a yearly basis, the Purchase Index is down by 8.6%, while the Refinance Index increased by 87.2%.

The average monthly 30-year fixed mortgage rate has fallen for four straight months with August seeing the largest decrease of 40 basis points (bps), bringing the rate to 6.49%. The current rate is 73 bps lower than last August.

The average loan size for the total market (including purchases and refinances) is up 3.6% from July to $380,800 on a non-seasonally adjusted (NSA) basis. Similarly, the month-over-month change for purchase loans increased 0.6% to an average size of $426,600, while refinance loans rose by 18.5% to an average of $325,800. The average loan size for an adjustable-rate mortgage (ARM) also saw a steep increase of 9.5% for the same period, from $1.01 million to $1.1 million.

Discover more from Eye On Housing

Subscribe to get the latest posts sent to your email.


This article was originally published by a eyeonhousing.org . Read the Original article here. .


The Market Composite Index, a measure of mortgage loan application volume by the Mortgage Bankers Association’s (MBA) weekly survey, saw a slight month-over-month decline of 0.8% on a seasonally adjusted (SA) basis; compared to July 2023, the index increased by 0.5%. The Purchase Index declined by 4.8%, while the Refinance Index increased by 5.8%, month-over-month. On a yearly basis, the Purchase Index decreased by 13.9%, while the Refinance Index increased by 33.9%.

Meanwhile, the average monthly 30-year fixed mortgage rate continued to decline for three straight months with July seeing the largest decrease of 10 basis points (bps) to land an at 6.88% in July. The current rate is also lower than last July by 6 bps.

The average loan size for the total market (including purchases and refinances) is down by 1.5% from June to $367,900 on a non-seasonally adjusted (NSA) basis in July. Similarly, the month-over-month change for purchase loans decreased 1.6% to an average size of $424,200, while refinance loans increased by 2.5% to an average of $275,325. The average loan size for an adjustable-rate mortgage (ARM) decreased by 2.5% for the same period, from $1.03 million to $1.01 million.

Discover more from Eye On Housing

Subscribe to get the latest posts sent to your email.


This article was originally published by a eyeonhousing.org . Read the Original article here. .

Pin It