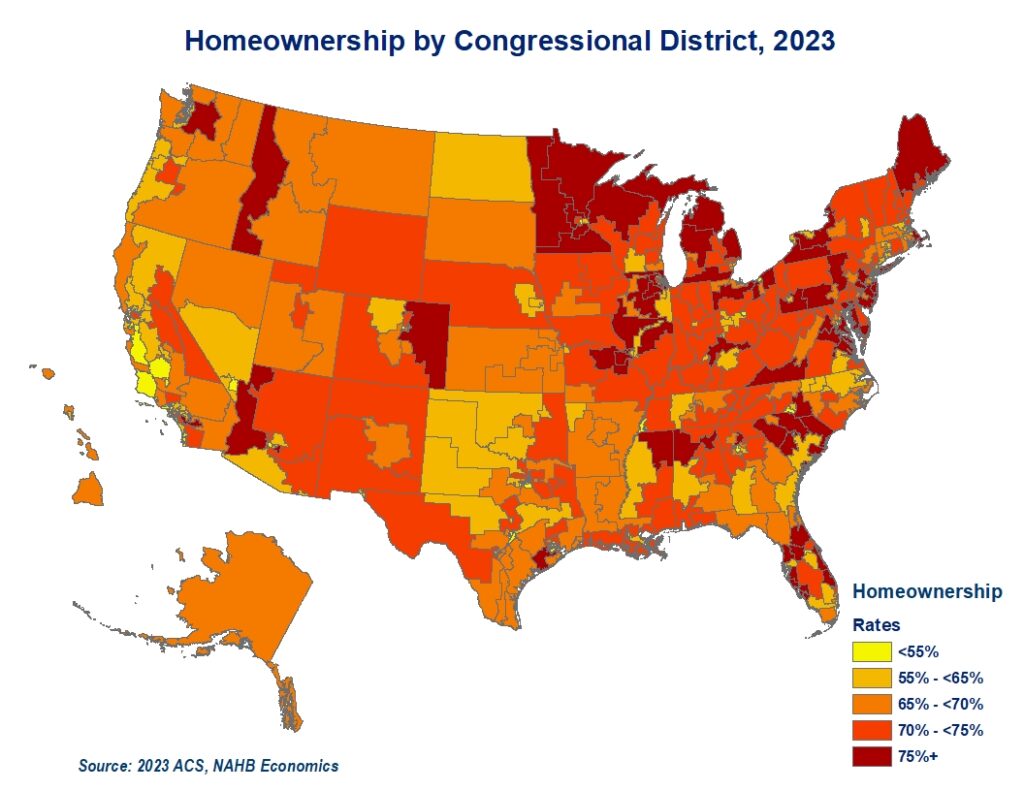
With housing being a key issue for the 2024 election cycle, it is worth analyzing distinct characteristics as well as similarities that housing markets in congressional districts share. The differences start with a substantial variation in homeownership rates across congressional districts.
While the 2023 American Community Survey (ACS) reports that close to two thirds of US households (65.2%) are home owners, there are forty congressional districts where renter households represent the majority. In twelve of these districts, renters account for more than two thirds of households. This list includes eight urban high-density congressional districts in New York, three districts in California and New Jersey’s 8th congressional district. The pattern of urban congressional districts registering lower home ownership rates repeats across the country.
At the other end of the spectrum, there are seven congressional districts with home owners representing over 80% of households. These include three districts in Michigan, two in New York, and one in both Maryland, and Minnesota.
New York stands out with simultaneous congressional districts with the lowest and second highest homeownership rates. Close to 84% of households in New York’s 1st district located in eastern Long Island are home owners. The only other congressional district that registers a higher homeownership rate is Michigan’s 9th congressional district located in the Thumb at 85%. In contrast, in New York’s urban 13th and 15th districts, home owners comprise a minority of less than 16% and 13%, respectively.
California is another example of substantial variation of homeownership rates across congressional districts within a state. In California’s 41st district in Riverside County, 3 out of 4 households are home owners. At the same time, in California’s 34th district in the city of Los Angeles, only 22% of households live in a home they own.
Population density, racial and ethnical makeup, as well as varying cost of ownership, all contribute to substantial variation in homeownership rates across the US congressional districts.
Additional housing data for your congressional district are provided by the US Census Bureau here.
Discover more from Eye On Housing
Subscribe to get the latest posts sent to your email.
This article was originally published by a eyeonhousing.org . Read the Original article here. .


