Despite high mortgage rates, the lack of resale homes and pent-up demand drove solid growth in single-family permits across nearly all regions in the second quarter. In contrast, multifamily construction permit activity experienced declines across all regions for the second quarter of 2024. These trends are tabulated from the recent release of the National Association of Home Builders’ (NAHB) Home Building Geography Index (HBGI).
Single-Family
All markets for single-family construction saw higher growth in the second quarter compared to the first quarter. In contrast to the second quarter of 2023, which experienced declines across all markets, this year shows a clear reversal. Large metro core counties had the largest growth rate for the second consecutive quarter at 17.6%, while micro counties continued to have the lowest for the third straight quarter, at 3.4%.
Looking at single-family HBGI market shares, small metro core counties continued to have the largest market share at 28.9%. Large metro suburban counties are the only other market with over 20% market share, at 25.0% in the second quarter. The smallest market share continued to be non metro/micro counties at 4.3%. However, this market remains almost a percentage point higher than what it was pre-pandemic in 2019.
Multifamily
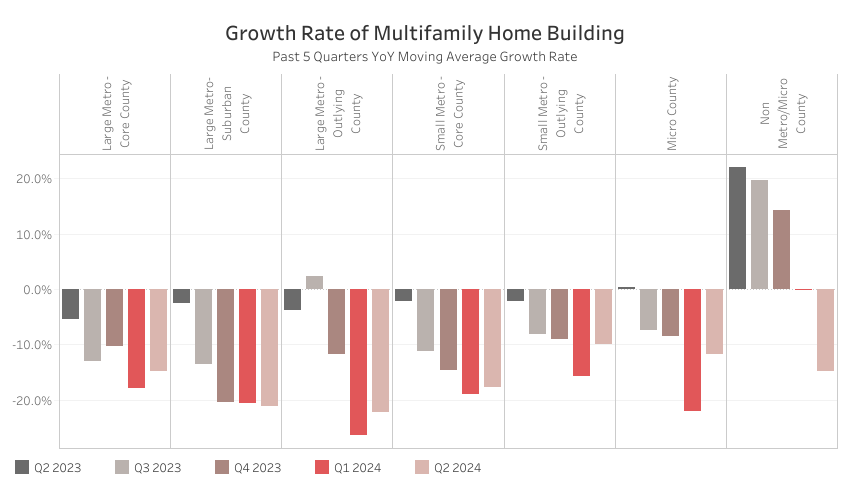
In the multifamily sector, the HBGI year-over-year growth continued to post declines for all markets in the second quarter. This can be contributed to high levels of multifamily units under construction and tighter financial conditions. Only two markets had larger declines than the first quarter, with large metro suburban counties down 21.1% and non metro/micro counties down 14.8%. Notably, non metro/micro counties were the last market to experience a decline in multifamily construction. These counties were an area of growth in the second, third and fourth quarters of last year while all other markets experience declines or negligible growth.
Multifamily market shares in the HBGI remained similar to the first quarter, with large metro core counties having the largest market share at 40.1%. The smallest market was non metro/micro counties, with a 1.1% market share.
The second quarter of 2024 HBGI data along with an interactive HBGI map can be found at http://nahb.org/hbgi.
Discover more from Eye On Housing
Subscribe to get the latest posts sent to your email.
This article was originally published by a eyeonhousing.org . Read the Original article here. .


